


SERIES SINUSOIDAL CIRCUITS 357 ()Show that your measurements from parts (b) and (h) satisfy Kirchhoff's voltage VE using peak-to-peak values. law. That is, show that E V + Calculation: (k) The phase angle between V (in phase with I) and V, should be 90°. Does lel + 101 90°? What is the magnitude of the percent difference ((90-sum)/90) x 100 % ? % Difference D Using E 8 V 20°, R- 1 kn, and L 100 mH, calculate Ve V, and I atf 10 kHz (peak-to-peak values) and draw the phasor diagram using peak-to-peak values. Determine the phase angle 6, between E and Vg and compare to the measured value of (c). Determine 8, from the phasor diagram and compare to 6, of (i). Record the values of 0, and 8, in Table 9.1. Show all work. Organize the presentation. Calculation:
litlaio: o MOu puooas aun ui samsaa op paooa u30Mjaq au aseyd on ou tuunuadx 1'6 -ur poupauu ao-enp an Susn A pue pnpon ( T6 L Jo MOJ puooos o n Pao3o puna3 uoumoo e ary adoosoroso on pue (aojeaaua8 o) ao so on e aunsus o) anseo pue 7 pue y jo suogrsod oup asaa () o1nsu anos iq paujejdxa aq suoseau :upunoa Jog ueoduy s dais pxau au cicie eue jo aounos au umdxo pue () pue () jo smsaa aq aedu ) jo 13aa o auou anjeA JOSIsau paunseaa op pue aournpuj op jo aneA adaueu th uauns pue (aaue pue apmute) aourpadu peo tan supsai aup u d-7wo aourpodun ndut a oun (a) 2a o uunjoo 96
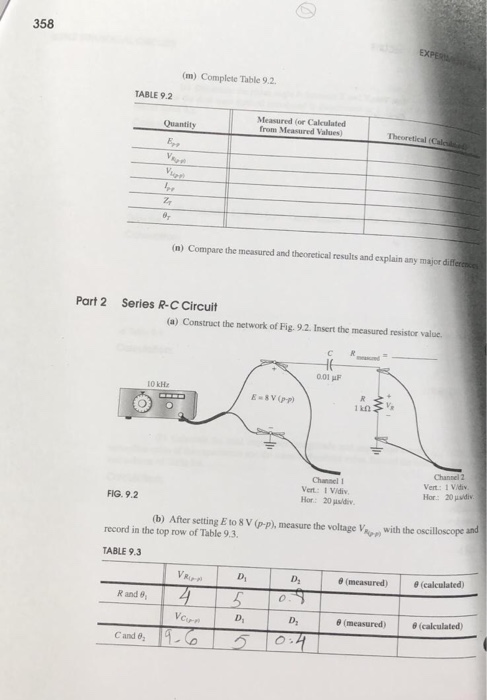
358 EXPER (m) Complete Table 9.2 TABLE 9.2 Measured (or Calculated from Measured Values) Theoretical (Caled Quantity E V Vi (n) Compare the measured and theoretical results and explain any major differences Series R-C Circuit Part 2 (a) Construct the network of Fig. 9.2. Insert the measured resistor value C 0.01 uF 10 kHa R E-SV(pph 1 k0 Channel 2 Vert: 1 Vidiv Hor: 20 usdiv Channel 1 Vert: I Vidiv Hor 20 ualdiv FIG. 9.2 (b) After setting E to 8 V (p-p), measure the voltage V wilh the oscilloscope and record in the top row of Table 9.3 TABLE 9.3 e (calculated) e (measured) VR D. D 5 0. R and 9 e (calculated) (measured ) D D Vc O.4 C and 8
SERIES SINUSOIDAL CIRCUITS 359 (c) Determine the phase angle 0, between E and V, using the connections shown in Fig. 9.2 and the dual-trace method introduced in Experiment ac 8. Record the results in the top row of Table 9.3 Calculation: (d) Determine 1,, from 1. VJR Enter the results in the first column of Table 9.4 Calculation: (e) Determine the input impedance from Z,- E, JI.and record in the first column of Table 9.4. Calculation: (f) Calculate the total impedance (magnitude and angle) and current nameplate value of the capacitance and the measured resistor value. Record the results in the sec- 1 from the ond column of Table 9.4. Calculation:
360 EXPERNG (g) Compare the results of (e) and (f) and explain the source of any difice (h) Reverse the positions of R and C and measure Vee (to ensure that the tor (or generator) and the oscilloscope have a common ground). Record the results in the bo row of Table 9.3 Determine the phase angle 8, between E and Ve using the dual-trace mehod (i) troduced in Experiment 8 and record the results in the bottom row of Table 9.3, Calculation: () The phase angle between V, (in phase with I) and Ve should be 90. Dee lel+10 90°? What is the magnitude of the percent difference (90-sum/90) x 100% % Difference (k) Using E = 8 V 20, R1 kn, and C-0.01 uF. calculate V Vo and I at f 10 kHz (peak-to-peak values) and draw the phasor diagram using peak-to-peak values. Determine the phase angle 0, between E and V, and compare to the measured value of 2(c). Determine 6 from the phasor diagram and compare to 8, of (i). Record the results for 6, and 8, in last column of Table 9.3. Calculation:
SERIES SINUSOIDAL CIRCUITS 361 D Complete Table 9.4. TABLE 9.4 Measured (or Calculated from Measured Values) Theoretical (Calculated) Quantity E VAr Vo (m) Compare the measured and theoretical results and explain any major differences Series R-L-C Circuit Part 3 (a) Construct the network of Figure 9.3. Insert the measured resistance values. Ig- nore the effects of R, in the following analysis R. mead 000 I kn 10 m t0 kHe E-S Vp V 001 uF e Channel 1 Vert I Vidiv Hor 20 psidiv FIG 9.3 (b) Measure all the component voltages with E= 8 V (P-p). To ensure a common ground between the oscilloscope and oscillator for each measurement, make sure the element is placed in the position of the capacitor C. In other words, reverse the order of the elements so that the element across which the voltage is to be measured has the position of C indicated in Fig. 9.3. Record the results in Table 9.5
EXPERIM 362 TABLE 9.5 Measured Calculated 5.0 V Vg Vco Z V and record in the first colume (c) Determine 1, from 1- VJR Table 9.5 Calculation: (d) Calculate Z, from Z.E. JL..and place the result in the first column of Table 9.5. Calculation: (e) Using the nameplate values for L and C and the measured value for R, calculate Z, and record in the second column of Table 9.5 Calculation:
SERIES SINUSOIDAL CIRCUITS 363 Compare with the result from part 3(d). ( Using E8VZ0, find I, Ve V., and Ve using peak-to-peak values. Recond the results in the second column of Table 9.5. Calculation: (g) Draw the phasor diagram, including I and all the voltages. Vh(V-V using the (h) Verify Kirchhoff's law by showing that E measured peak-to-peak values.
364 EXPERINE () Use the voltage divider rule to calculate the voltage V and record ond column of Table 9.5 Calculation: (j) Measure the voltage V and record in Table 9.5. Compare to the result of 30 EXERCISES 1. Using measured voltage levels and R a frequency of 10 kHz determine the actual inductance L of Fig. 9.1 at Calculation: L=
SERIES SINUSOIDAL CIRCUITS 365 2 Using measured yoltage levels and R.- at a frequency of 10 kHz determine the actual capacitance C of Fig. 9.2 Calculation: C 3. Using the inductance L from problem 1 and the capacitance C from problem 2, calculate the total impedance Z, for the network of Fig. 9.3 and compare to the measured value. Calculation: Z,=
366 EXPERIMENTd 4. Using PSpice or Multisim, determine the voltages Ve. V, and Ve for the network of Fe and compare with the measured values of Table 9.5. Attach all appropriate printouts.
Homework Answers


Add Answer to:
I need a help with my lab, I write all data that get.
355 SERIES SINUSOIDAL...
355 SERIES SINUSOIDAL CIRCUITS measared 000 10 mH 10 kHz R E-8V (P-p) Va 1 kn...
 355 SERIES SINUSOIDAL CIRCUITS measared 000 10 mH 10 kHz R E-8V (P-p) Va 1 kn Channel 2 Vert: 1 Vidiv. Har: 20 μεiv . Channel I 1 Vidiv Vert Hoc : 20 μdiv. FIG. 9.1 After setting E to 8 V (p-p), determine the peak-to-peak voltage for Ve from chan- (b) nel 2 and record in the top row of Table 9.1. (c) Determine the phase angle e, between E and Vg using the connections shown in Fig. 9.1...
Course and Section cto EXPERIMENT ac series-Parallel Sinusoidal Circuits OBJECTIVES 1. Measure th...
 Course and Section cto EXPERIMENT ac series-Parallel Sinusoidal Circuits OBJECTIVES 1. Measure the currents of series-parallel R-L and R-C networks using sensing resistors 2. Demonstrate the Pythagorean relationship between the currents of the networks. 3. Measure the phase angles associated with the currents of the networks. 4. Calculate the input impedance of a parallel network using measured values EQUIPMENT REQUIRED Instruments Resistors 1-10-Q, 470-Ω, l-kM (14.W) Inductors 1-10-mH Capacitors 1-0.02-pF I-DMM 1--Oscilloscope 1-Audio oscillator or function generator 1--Frequency counter (if...
Bridge Network Part 4 (a) Construct the network of Fig. 14.4. Insert the measured resistor values...
 Bridge Network Part 4 (a) Construct the network of Fig. 14.4. Insert the measured resistor values R3 3.3 k R=3.3 k RImeasured = Vs- R 2.2 k R2 measured - R3 measured E 20 V Is Ra measured =1.2 k = 2.2 k Ra R3 A5 measured FIG. 14.4 (b) Using any one of the three techniques examined in this experiment, calculate the voltage Vs and the current Is. Use the measured resistor values. Record the results in the "Calculated"...
PROCEDU Part 1 Resistance (a) Construct the circuit of Fig. 4.1. Insert the measured values of...
 PROCEDU Part 1 Resistance (a) Construct the circuit of Fig. 4.1. Insert the measured values of the counter if available mined by the ohmmeter section of your multimeter. Hook up the frequeney Red r measured / 100Ω Sensing resistor Red measured 500 Hz Oscilloscope Black Black FIG. 4.1 Caution: Always ensure that the ground of the oscilloscope is connected to the ground of the oscillator. Otherwise a hazardous situation may result (b) Set the voltage across R to 4 V...
would you like please answer all questions in part 3 THEVENIN'S THEOREM AND MAXIMUM POWER TRANSFER...
 would you like please answer all questions in part 3
THEVENIN'S THEOREM AND MAXIMUM POWER TRANSFER 131 Part 3 Maximum Power Transfer (Experimental Approach) (a) Construct the network of Fig. 11.8. Insert the measured value of each resistor R EIOV 95.732 218S2 325 2 . 424e R FIG. 11.8 Eths Vabs 6.8v Rths Resissn (b) The Thevenin equivalent circuit will now be determined for the network to the lel of the terminals a-b without disturbing the structure of the network....
would you like please answer all questions in part 3
THEVENIN'S THEOREM AND MAXIMUM POWER TRANSFER 131 Part 3 Maximum Power Transfer (Experimental Approach) (a) Construct the network of Fig. 11.8. Insert the measured value of each resistor R EIOV 95.732 218S2 325 2 . 424e R FIG. 11.8 Eths Vabs 6.8v Rths Resissn (b) The Thevenin equivalent circuit will now be determined for the network to the lel of the terminals a-b without disturbing the structure of the network....
Ive attacthed all my results. I just need help calculating question 4 and 5 (5 pts)...
 Ive
attacthed all my results. I just need help calculating question 4
and 5
(5 pts) Part II. Your experimental data: how many sig figs should your temperature data have? Show work for one calculation of temp in Kelvin. Show work for one AG calculation: Approximate Measured Cell Calculated Temp (°C) Calculated Temp (°C) potential Temp (K) AG Ecell (V)* (kJ/mol)* * measured value 70.21 0.581 343 1-112.1 65.12 0.680338 - 111.9 Show work: 60.02 0.5715333 -1110 °C -> 5.05+278.15...
Ive
attacthed all my results. I just need help calculating question 4
and 5
(5 pts) Part II. Your experimental data: how many sig figs should your temperature data have? Show work for one calculation of temp in Kelvin. Show work for one AG calculation: Approximate Measured Cell Calculated Temp (°C) Calculated Temp (°C) potential Temp (K) AG Ecell (V)* (kJ/mol)* * measured value 70.21 0.581 343 1-112.1 65.12 0.680338 - 111.9 Show work: 60.02 0.5715333 -1110 °C -> 5.05+278.15...
Below is a lab hand out for the questions. All my data for the questions are...
Below is a lab hand out for the questions. All my data for the questions are filled out below in BOLD LETTERING. All the questions I need answered are at the bottom with boxes where to put the answers. Background Alka-Seltzer� is an over-the-counter antacid and pain relief drug. The tablet contains aspirin (acetylsalicylic acid), citric acid, and sodium bicarbonate (NaHCO3). Sodium bicarbonate (NaHCO3) is responsible for the effervescent action of Alka-Seltzer. In this lab we will investigate the reaction...
This was a analysis questioned asked on my lab report ? I need help, I included...
This was a analysis questioned asked on my lab report ? I need help, I included part C on there and the whole procedure of how it works. Will you please help me how to determine the concentration in a concentration % ? Heres the question: 4. For the 10 mixtures that were created in Part C: Classification of Mixtures procedure, determine the concentration in a concentration % (m/m, v/v, or m/v). Include a unit with your value and a...
help please, i dont know how to do it Charging A 1000uF capacitor was charged using...
 help please, i dont know how to do it
Charging A 1000uF capacitor was charged using a battery of Vo = 10V via two resistors Ry = 47kN and R2 = 27k1. The simulation was run for a total time duration of 300s. Fig 1(a) shows the charging circuit used for the simulation, Fig 1() shows the Voltage vs. time (V-t) response of the circuit charging via Rę = 47kN and Fig 1(c) shows the (V-1) response of the circuit...
help please, i dont know how to do it
Charging A 1000uF capacitor was charged using a battery of Vo = 10V via two resistors Ry = 47kN and R2 = 27k1. The simulation was run for a total time duration of 300s. Fig 1(a) shows the charging circuit used for the simulation, Fig 1() shows the Voltage vs. time (V-t) response of the circuit charging via Rę = 47kN and Fig 1(c) shows the (V-1) response of the circuit...
Properties of Buffers Lab. I need help with problems 7 & 8. They’re pretty similar, but...
 Properties of Buffers Lab.
I need help with problems 7 & 8. They’re pretty similar,
but I’m confused on whether I’m doing them right.
I need to calculate the moles of HCl and NaOH and then somehow
insert them into the log fraction in the Henderson Hasselbach
formula, is that right?
Procedure (values are needed in procedure):
Measured values during lab that I’ll be comparing #6/7/8
to:
Questions I need help with:
Part B Procedures: 1. Weigh about 3.5g of...
Properties of Buffers Lab.
I need help with problems 7 & 8. They’re pretty similar,
but I’m confused on whether I’m doing them right.
I need to calculate the moles of HCl and NaOH and then somehow
insert them into the log fraction in the Henderson Hasselbach
formula, is that right?
Procedure (values are needed in procedure):
Measured values during lab that I’ll be comparing #6/7/8
to:
Questions I need help with:
Part B Procedures: 1. Weigh about 3.5g of...
 355 SERIES SINUSOIDAL CIRCUITS measared 000 10 mH 10 kHz R E-8V (P-p) Va 1 kn Channel 2 Vert: 1 Vidiv. Har: 20 μεiv . Channel I 1 Vidiv Vert Hoc : 20 μdiv. FIG. 9.1 After setting E to 8 V (p-p), determine the peak-to-peak voltage for Ve from chan- (b) nel 2 and record in the top row of Table 9.1. (c) Determine the phase angle e, between E and Vg using the connections shown in Fig. 9.1...
 Course and Section cto EXPERIMENT ac series-Parallel Sinusoidal Circuits OBJECTIVES 1. Measure the currents of series-parallel R-L and R-C networks using sensing resistors 2. Demonstrate the Pythagorean relationship between the currents of the networks. 3. Measure the phase angles associated with the currents of the networks. 4. Calculate the input impedance of a parallel network using measured values EQUIPMENT REQUIRED Instruments Resistors 1-10-Q, 470-Ω, l-kM (14.W) Inductors 1-10-mH Capacitors 1-0.02-pF I-DMM 1--Oscilloscope 1-Audio oscillator or function generator 1--Frequency counter (if...
 Bridge Network Part 4 (a) Construct the network of Fig. 14.4. Insert the measured resistor values R3 3.3 k R=3.3 k RImeasured = Vs- R 2.2 k R2 measured - R3 measured E 20 V Is Ra measured =1.2 k = 2.2 k Ra R3 A5 measured FIG. 14.4 (b) Using any one of the three techniques examined in this experiment, calculate the voltage Vs and the current Is. Use the measured resistor values. Record the results in the "Calculated"...
 PROCEDU Part 1 Resistance (a) Construct the circuit of Fig. 4.1. Insert the measured values of the counter if available mined by the ohmmeter section of your multimeter. Hook up the frequeney Red r measured / 100Ω Sensing resistor Red measured 500 Hz Oscilloscope Black Black FIG. 4.1 Caution: Always ensure that the ground of the oscilloscope is connected to the ground of the oscillator. Otherwise a hazardous situation may result (b) Set the voltage across R to 4 V...
 would you like please answer all questions in part 3
THEVENIN'S THEOREM AND MAXIMUM POWER TRANSFER 131 Part 3 Maximum Power Transfer (Experimental Approach) (a) Construct the network of Fig. 11.8. Insert the measured value of each resistor R EIOV 95.732 218S2 325 2 . 424e R FIG. 11.8 Eths Vabs 6.8v Rths Resissn (b) The Thevenin equivalent circuit will now be determined for the network to the lel of the terminals a-b without disturbing the structure of the network....
would you like please answer all questions in part 3
THEVENIN'S THEOREM AND MAXIMUM POWER TRANSFER 131 Part 3 Maximum Power Transfer (Experimental Approach) (a) Construct the network of Fig. 11.8. Insert the measured value of each resistor R EIOV 95.732 218S2 325 2 . 424e R FIG. 11.8 Eths Vabs 6.8v Rths Resissn (b) The Thevenin equivalent circuit will now be determined for the network to the lel of the terminals a-b without disturbing the structure of the network....
 Ive
attacthed all my results. I just need help calculating question 4
and 5
(5 pts) Part II. Your experimental data: how many sig figs should your temperature data have? Show work for one calculation of temp in Kelvin. Show work for one AG calculation: Approximate Measured Cell Calculated Temp (°C) Calculated Temp (°C) potential Temp (K) AG Ecell (V)* (kJ/mol)* * measured value 70.21 0.581 343 1-112.1 65.12 0.680338 - 111.9 Show work: 60.02 0.5715333 -1110 °C -> 5.05+278.15...
Ive
attacthed all my results. I just need help calculating question 4
and 5
(5 pts) Part II. Your experimental data: how many sig figs should your temperature data have? Show work for one calculation of temp in Kelvin. Show work for one AG calculation: Approximate Measured Cell Calculated Temp (°C) Calculated Temp (°C) potential Temp (K) AG Ecell (V)* (kJ/mol)* * measured value 70.21 0.581 343 1-112.1 65.12 0.680338 - 111.9 Show work: 60.02 0.5715333 -1110 °C -> 5.05+278.15...
 help please, i dont know how to do it
Charging A 1000uF capacitor was charged using a battery of Vo = 10V via two resistors Ry = 47kN and R2 = 27k1. The simulation was run for a total time duration of 300s. Fig 1(a) shows the charging circuit used for the simulation, Fig 1() shows the Voltage vs. time (V-t) response of the circuit charging via Rę = 47kN and Fig 1(c) shows the (V-1) response of the circuit...
help please, i dont know how to do it
Charging A 1000uF capacitor was charged using a battery of Vo = 10V via two resistors Ry = 47kN and R2 = 27k1. The simulation was run for a total time duration of 300s. Fig 1(a) shows the charging circuit used for the simulation, Fig 1() shows the Voltage vs. time (V-t) response of the circuit charging via Rę = 47kN and Fig 1(c) shows the (V-1) response of the circuit...
 Properties of Buffers Lab.
I need help with problems 7 & 8. They’re pretty similar,
but I’m confused on whether I’m doing them right.
I need to calculate the moles of HCl and NaOH and then somehow
insert them into the log fraction in the Henderson Hasselbach
formula, is that right?
Procedure (values are needed in procedure):
Measured values during lab that I’ll be comparing #6/7/8
to:
Questions I need help with:
Part B Procedures: 1. Weigh about 3.5g of...
Properties of Buffers Lab.
I need help with problems 7 & 8. They’re pretty similar,
but I’m confused on whether I’m doing them right.
I need to calculate the moles of HCl and NaOH and then somehow
insert them into the log fraction in the Henderson Hasselbach
formula, is that right?
Procedure (values are needed in procedure):
Measured values during lab that I’ll be comparing #6/7/8
to:
Questions I need help with:
Part B Procedures: 1. Weigh about 3.5g of...
Most questions answered within 3 hours.
-
Where is the error in this code sequence?
String s1 = "Hello";
String s2 = "ello";...
asked 11 months ago -
Financial data for Joel de Paris, Inc., for last year
follow:
Joel de Paris, Inc.
Balance...
asked 11 months ago -
Consider this reaction:
Al2(SO4)3 (aq)+ BaCl3
(aq) Al2Cl6 (aq)- +
3BaSO4(s) . What is the...
asked 11 months ago -
Suppose that Savneet is considering increasing her
recent random sample from 20 car rentals to 40...
asked 11 months ago -
Trucks arrive at an unloading terminal at an average rate of 120
per hour.
Trucks arrive...
asked 11 months ago -
Why are methanol and ethanol completely soluble in water while
octanol is not very little soluble....
asked 11 months ago -
A facilities manager at a university reads in a research report
that the mean amount of...
asked 11 months ago -
When the CuSO4 is rehydrated by adding water to the anhydrous
compound, is this an endothermic...
asked 11 months ago -
A ray of sunlight is passing from diamond into crown glass; the
angle of incidence is...
asked 11 months ago -
A block of mass 0.249 kg is placed on top of a light, vertical
spring of...
asked 11 months ago -
how do the kidneys compensate in the presences of acidosis
a) trigger hyperventilate
b) reserve acid...
asked 11 months ago -
Question 501 pts
The rental rate of capital to the firm increases. Which of the
following...
asked 11 months ago