
Homework Answers
Add Answer to:
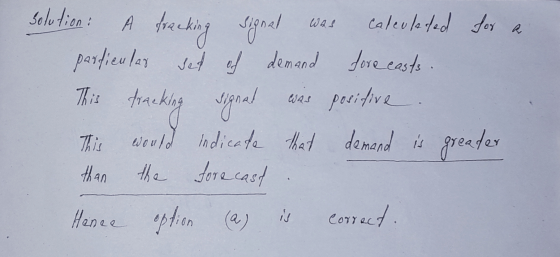
Question 12 (1 point) A tracking signal was calculated for a particular set of demand forecasts....
This data will be used for Questions 8-14. The number of flowers sold at The Blossom...
 This data will be used for Questions 8-14. The number of flowers sold at The Blossom Shop on Fridays is shown in the table below. Round off all calculations to two decimal places. Maintaining two decimal places is required for all calculations Week Demand Week Demand Week Demand 161 1 155 6 11 168 2 162 7 148 12 167 3 164 153 13 165 4 165 160 14 160 158 10 164 15 155 LO What is the forecast...
Two different forecasting techniques (F1 and F2) were used to forecast demand for cases of bottle...
 Two different forecasting techniques (F1 and F2) were used to forecast demand for cases of bottled water. Actual demand and the two sets of forecasts are as follows: PREDICTED DEMAND Period Demand 68 75 70 74 69 72 80 78 F1 67 F2 60 62 70 72 75 75 76 85 73 74 70 71 75 a. Compute MAD for each set of forecasts. Given your results, which forecast appears to be more accurate? (Round your answers to 2 decimal...
Two different forecasting techniques (F1 and F2) were used to forecast demand for cases of bottled...
Two different forecasting techniques (F1 and F2) were used to forecast demand for cases of bottled water. Actual demand and the two sets of forecasts are as follows: PREDICTED DEMAND Period Demand F1 F2 1 68 62 67 2 75 69 68 3 70 72 70 4 74 66 70 5 69 73 72 6 72 65 76 7 80 74 79 8 78 74 85 a. Compute MAD for each set of forecasts. Given your results, which forecast appears...
Two different forecasting techniques (F1 and F2) were used to forecast demand for cases of bottled...
Two different forecasting techniques (F1 and F2) were used to forecast demand for cases of bottled water. Actual demand and the two sets of forecasts are as follows: PREDICTED DEMAND Period Demand F1 F2 1 68 63 62 2 75 66 61 3 70 73 70 4 74 65 71 5 69 71 73 6 72 69 73 7 80 70 76 8 78 72 80 a. Compute MAD for each set of forecasts. Given your results, which forecast appears...
please i need asap answer 1. Given the data below, compute for the following: a) Forecasts...
 please i need asap
answer
1. Given the data below, compute for the following: a) Forecasts for P5 to P12 using a 4-period simple moving average b) Forecasts for P5 to P12 using a 4-month weighted moving average with the following weights: Most recent period = 0.40 2nd most recent period = 0.30 3rd most recent period = 0.20 4th most recent period = 0.10 Assuming a forecast of 5,000 units for Period 4 and a = 0.30, compute for...
please i need asap
answer
1. Given the data below, compute for the following: a) Forecasts for P5 to P12 using a 4-period simple moving average b) Forecasts for P5 to P12 using a 4-month weighted moving average with the following weights: Most recent period = 0.40 2nd most recent period = 0.30 3rd most recent period = 0.20 4th most recent period = 0.10 Assuming a forecast of 5,000 units for Period 4 and a = 0.30, compute for...
Exercise # 1-0M6322-week 4-Forecasting using Exponential Smoothing The first five periods of demand data are shown...
 Exercise # 1-0M6322-week 4-Forecasting using Exponential Smoothing The first five periods of demand data are shown in the following table Let the smoothing coefficient, alpha, equal 0.2.Compute the exponentially smoothed forecasts for periods one through four Initialize the procedure with a forecast value for period one of 37 Period Aggregate Demand Forecast demand 38 42 40 36 42 37 Determine the Running Sum of Forecast Errors (RSFE), the Mean Absolute Deviation, MADt Land the Tracking Signal(TS) at the end of...
The following table shows predicted product demand using your particular forecasting method along with the actual...
The following table shows predicted product demand using your particular forecasting method along with the actual demand that occurred: FORECAST ACTUAL 1,490 1,540 1,390 1,490 1,690 1,590 1,742 1,640 1,790 1,690 a. Compute the tracking signal using the mean absolute deviation and running sum of forecast errors. (Negative values should be indicated by a minus sign. Round your "Mean Absolute Deviation", "Tracking Signal" to 2 decimal places and all other answers to the nearest whole number.) Period Forecast Actual Deviation...
QUESTION 24 if good A and good Bare complements, then the cross price elasticity of demand...
 QUESTION 24 if good A and good Bare complements, then the cross price elasticity of demand of good A for a change in the price of good B negative, zero. positive and less than 1. positive and greater than 1. QUESTION 25 If good A and good B are substitutes, then the cross price elasticity of demand of good A for a change in the price of good Bis negative but less negative than-1. negative and more negative than-1. zero....
question 11 rlexibility responsiveness Question 11 (1 point) When a demand curve is perfectly elastic, its...
 question 11
rlexibility responsiveness Question 11 (1 point) When a demand curve is perfectly elastic, its price elasticity of demand coefficient is less than one zero greater than one B infinity Question 12 (1 point) When a demand curve is perfectly inelastic, we can describe it as being
question 11
rlexibility responsiveness Question 11 (1 point) When a demand curve is perfectly elastic, its price elasticity of demand coefficient is less than one zero greater than one B infinity Question 12 (1 point) When a demand curve is perfectly inelastic, we can describe it as being
The actual tracking weight of a stereo cartridge that is set to track at 4.0 g...
 The actual tracking weight of a stereo cartridge that is set to track at 4.0 g on a particular changer can be regarded as a continuous rv X with the following pdf. f(x)*1-(-4.0)2 ] 335 otherwise (a) Find the value of k. (b) What is the probability that the actual tracking weight is greater than the prescribed weight? (c) What is the probability that the actual weight is within .25 g of the prescribed weight? (d) What is the probability...
 This data will be used for Questions 8-14. The number of flowers sold at The Blossom Shop on Fridays is shown in the table below. Round off all calculations to two decimal places. Maintaining two decimal places is required for all calculations Week Demand Week Demand Week Demand 161 1 155 6 11 168 2 162 7 148 12 167 3 164 153 13 165 4 165 160 14 160 158 10 164 15 155 LO What is the forecast...
 Two different forecasting techniques (F1 and F2) were used to forecast demand for cases of bottled water. Actual demand and the two sets of forecasts are as follows: PREDICTED DEMAND Period Demand 68 75 70 74 69 72 80 78 F1 67 F2 60 62 70 72 75 75 76 85 73 74 70 71 75 a. Compute MAD for each set of forecasts. Given your results, which forecast appears to be more accurate? (Round your answers to 2 decimal...
 please i need asap
answer
1. Given the data below, compute for the following: a) Forecasts for P5 to P12 using a 4-period simple moving average b) Forecasts for P5 to P12 using a 4-month weighted moving average with the following weights: Most recent period = 0.40 2nd most recent period = 0.30 3rd most recent period = 0.20 4th most recent period = 0.10 Assuming a forecast of 5,000 units for Period 4 and a = 0.30, compute for...
please i need asap
answer
1. Given the data below, compute for the following: a) Forecasts for P5 to P12 using a 4-period simple moving average b) Forecasts for P5 to P12 using a 4-month weighted moving average with the following weights: Most recent period = 0.40 2nd most recent period = 0.30 3rd most recent period = 0.20 4th most recent period = 0.10 Assuming a forecast of 5,000 units for Period 4 and a = 0.30, compute for...
 Exercise # 1-0M6322-week 4-Forecasting using Exponential Smoothing The first five periods of demand data are shown in the following table Let the smoothing coefficient, alpha, equal 0.2.Compute the exponentially smoothed forecasts for periods one through four Initialize the procedure with a forecast value for period one of 37 Period Aggregate Demand Forecast demand 38 42 40 36 42 37 Determine the Running Sum of Forecast Errors (RSFE), the Mean Absolute Deviation, MADt Land the Tracking Signal(TS) at the end of...
 QUESTION 24 if good A and good Bare complements, then the cross price elasticity of demand of good A for a change in the price of good B negative, zero. positive and less than 1. positive and greater than 1. QUESTION 25 If good A and good B are substitutes, then the cross price elasticity of demand of good A for a change in the price of good Bis negative but less negative than-1. negative and more negative than-1. zero....
 question 11
rlexibility responsiveness Question 11 (1 point) When a demand curve is perfectly elastic, its price elasticity of demand coefficient is less than one zero greater than one B infinity Question 12 (1 point) When a demand curve is perfectly inelastic, we can describe it as being
question 11
rlexibility responsiveness Question 11 (1 point) When a demand curve is perfectly elastic, its price elasticity of demand coefficient is less than one zero greater than one B infinity Question 12 (1 point) When a demand curve is perfectly inelastic, we can describe it as being
 The actual tracking weight of a stereo cartridge that is set to track at 4.0 g on a particular changer can be regarded as a continuous rv X with the following pdf. f(x)*1-(-4.0)2 ] 335 otherwise (a) Find the value of k. (b) What is the probability that the actual tracking weight is greater than the prescribed weight? (c) What is the probability that the actual weight is within .25 g of the prescribed weight? (d) What is the probability...
Most questions answered within 3 hours.
-
Where is the error in this code sequence?
String s1 = "Hello";
String s2 = "ello";...
asked 10 months ago -
Financial data for Joel de Paris, Inc., for last year
follow:
Joel de Paris, Inc.
Balance...
asked 10 months ago -
Consider this reaction:
Al2(SO4)3 (aq)+ BaCl3
(aq) Al2Cl6 (aq)- +
3BaSO4(s) . What is the...
asked 10 months ago -
Suppose that Savneet is considering increasing her
recent random sample from 20 car rentals to 40...
asked 10 months ago -
Trucks arrive at an unloading terminal at an average rate of 120
per hour.
Trucks arrive...
asked 10 months ago -
Why are methanol and ethanol completely soluble in water while
octanol is not very little soluble....
asked 10 months ago -
A facilities manager at a university reads in a research report
that the mean amount of...
asked 10 months ago -
When the CuSO4 is rehydrated by adding water to the anhydrous
compound, is this an endothermic...
asked 10 months ago -
A ray of sunlight is passing from diamond into crown glass; the
angle of incidence is...
asked 10 months ago -
A block of mass 0.249 kg is placed on top of a light, vertical
spring of...
asked 10 months ago -
how do the kidneys compensate in the presences of acidosis
a) trigger hyperventilate
b) reserve acid...
asked 10 months ago -
Question 501 pts
The rental rate of capital to the firm increases. Which of the
following...
asked 10 months ago