
Homework Answers
Here' the answer to the question. Let me know in case you've any doubts on the answer.
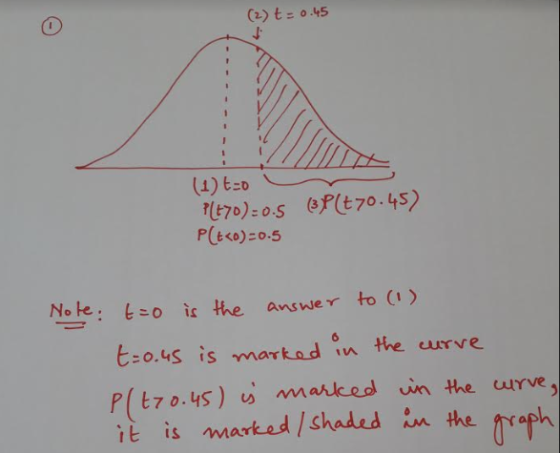
I've drawn and marked each of the 3 part' answer in the image below.
Just to take you through the answer:
(1) divides the distribution into 2 equal half, so the value at the center is t = 0
P(t > 0) = .5, P(t < 0) = .5
(2) t = .45, is marked to the right of t = 0 in the graph
(3) P(t > .45) is the area to the right of t = .45, it is shaded in the image
(1) , (2) and (3) are marked in the image. Please also see at the bottom of the image.
Add Answer to:
__1.- Below is the curve corresponding to the density function of the T test. Let's assume...
Shade the area under the standard normal curve corresponding to the probability below. P(1 ≤ z...
Shade the area under the standard normal curve corresponding to the probability below. P(1 ≤ z ≤ 2 ) a. b. c. d. e.
9. The data below are the hours spent studying and the corresponding test score earned. Assume...
 9. The data below are the hours spent studying and the corresponding test score earned. Assume that the variables x and y have a significant correlation. Hours spent studying, x 0 2 4 5 5 5 6 7 8 Test score, y 4051 64 69 73 75 9390 95 a) Sketch a scatter plot of the data on provided graph paper segment. (2 pts) b) Describe the type of correlation you see if one exists. (1 pts) c) Find the...
Shade the area under the st normal curve corresponding to the probability below Select one 3...
 Shade the area under the st normal curve corresponding to the probability below Select one 3 -2 1 0 1 2 3 3 -2 1 0 1 2 3
Let's say you conducted a t test to compare two samples. You calculated a t value...
Let's say you conducted a t test to compare two samples. You calculated a t value of -2.16. The critical t value was 2.24. Is the result statistically significant? Explain your answer.
Assume that a randomly selected subject is given a bone density test. Those test scores are...
Assume that a randomly selected subject is given a bone density test. Those test scores are normally distributed with a mean of 0 and a standard deviation of 1. Find the probability that a given score is less than negative 0.96 and draw a sketch of the region. Sketch the region. Choose the correct graph below. A. -0.96 A symmetric bell-shaped curve is plotted over a horizontal scale. A vertical line runs from the scale to the curve at labeled...
Hi, I'm considering the following question: "Let's say we just calculated the t-test statistic for the...
Hi, I'm considering the following question: "Let's say we just calculated the t-test statistic for the following hypotheses: H0: mu <= 34, Ha: mu > 34. The sample size was 25, and the test statistic turned out to be -2.84. What would be the correct conclusion? A- Do not reject the H0 - the p-value is smaller than alpha B- Reject the H0 - the test statistic is more extreme than the critical value C- Reject the H0 - the...
The nonnegative function given below is a probability density function. e-2t/3 if t 20 0 if...
 The nonnegative function given below is a probability density function. e-2t/3 if t 20 0 if t < 0 (a) Find P(Osts 3). (b) Find E(t).
1. Assume that a randomly selected subject is given a bone density test. Those test scores...
1. Assume that a randomly selected subject is given a bone density test. Those test scores are normally distributed with a mean of 0 and a standard deviation of 1. Find the probability that a given score is less than 3.87 and draw a sketch of the region. 2. Assume that a randomly selected subject is given a bone density test. Bone density test scores are normally distributed with a mean of 0 and a standard deviation of 1. Draw...
6.2.31-T Question Help Assume that a randomly selected subject is given a bone density test. Those...
 6.2.31-T Question Help Assume that a randomly selected subject is given a bone density test. Those test scores are normally distributed with a mean of O and a standard deviation of 1. Find the probability that a given score is between -2.07 and 3.92 and draw a sketch of the region. Sketch the region. Choose the correct graph below. ОА. Ов. Q Q A 207392 2.07 3.92 -2.07 3.92 -2.07 3.92 The probability is (Round to four decimal places as...
Assume that y' = y.t needs to solved i.e.one needs to find y(t) for the initial...
 Assume that y' = y.t needs to solved i.e.one needs to find y(t) for the initial condition yo = 0.3. In your Math classes, you were taught how to solve this differential equation. However, most differential equations are not easily solvable, and one needs to resort to numerical integration. This can easily be done in MATLAB for explicit first order differential equations like the one stated above. The time of interest is between tstart <t <tend let's say between O...
 9. The data below are the hours spent studying and the corresponding test score earned. Assume that the variables x and y have a significant correlation. Hours spent studying, x 0 2 4 5 5 5 6 7 8 Test score, y 4051 64 69 73 75 9390 95 a) Sketch a scatter plot of the data on provided graph paper segment. (2 pts) b) Describe the type of correlation you see if one exists. (1 pts) c) Find the...
 Shade the area under the st normal curve corresponding to the probability below Select one 3 -2 1 0 1 2 3 3 -2 1 0 1 2 3
 The nonnegative function given below is a probability density function. e-2t/3 if t 20 0 if t < 0 (a) Find P(Osts 3). (b) Find E(t).
 6.2.31-T Question Help Assume that a randomly selected subject is given a bone density test. Those test scores are normally distributed with a mean of O and a standard deviation of 1. Find the probability that a given score is between -2.07 and 3.92 and draw a sketch of the region. Sketch the region. Choose the correct graph below. ОА. Ов. Q Q A 207392 2.07 3.92 -2.07 3.92 -2.07 3.92 The probability is (Round to four decimal places as...
 Assume that y' = y.t needs to solved i.e.one needs to find y(t) for the initial condition yo = 0.3. In your Math classes, you were taught how to solve this differential equation. However, most differential equations are not easily solvable, and one needs to resort to numerical integration. This can easily be done in MATLAB for explicit first order differential equations like the one stated above. The time of interest is between tstart <t <tend let's say between O...
Most questions answered within 3 hours.
-
Where is the error in this code sequence?
String s1 = "Hello";
String s2 = "ello";...
asked 10 months ago -
Financial data for Joel de Paris, Inc., for last year
follow:
Joel de Paris, Inc.
Balance...
asked 10 months ago -
Consider this reaction:
Al2(SO4)3 (aq)+ BaCl3
(aq) Al2Cl6 (aq)- +
3BaSO4(s) . What is the...
asked 10 months ago -
Suppose that Savneet is considering increasing her
recent random sample from 20 car rentals to 40...
asked 10 months ago -
Trucks arrive at an unloading terminal at an average rate of 120
per hour.
Trucks arrive...
asked 10 months ago -
Why are methanol and ethanol completely soluble in water while
octanol is not very little soluble....
asked 10 months ago -
A facilities manager at a university reads in a research report
that the mean amount of...
asked 10 months ago -
When the CuSO4 is rehydrated by adding water to the anhydrous
compound, is this an endothermic...
asked 10 months ago -
A ray of sunlight is passing from diamond into crown glass; the
angle of incidence is...
asked 10 months ago -
A block of mass 0.249 kg is placed on top of a light, vertical
spring of...
asked 10 months ago -
how do the kidneys compensate in the presences of acidosis
a) trigger hyperventilate
b) reserve acid...
asked 10 months ago -
Question 501 pts
The rental rate of capital to the firm increases. Which of the
following...
asked 10 months ago