

Homework Answers
Formulas:
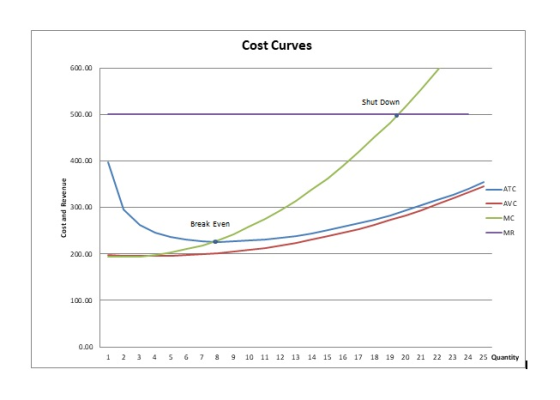
Total Cost =200+(200*Q)-(2.5*(Q^2))+((1/3)*(Q^3))
Total Variable Cost = (200*Q)-(2.5*(Q^2))+((1/3)*(Q^3))
Average Total Cost = Total Cost/Q
Average Variable Cost = Total Variable Cost//Q
Average Fixed Cost = 200/Q
Marginal Cost = TC2-TC1
Total Revenue = 500*Q
Marginal Revenue = TR2-TR1
(Replace Q with cell numbers on the excel sheet)
| Units | TC | TVC | ATC | AVC | AFC | MC | TR | MR |
| 1 | 397.83 | 197.83 | 397.83 | 197.83 | 200.00 | - | 500 | - |
| 2 | 592.67 | 392.67 | 296.33 | 196.33 | 100.00 | 194.83 | 1000 | 500 |
| 3 | 786.50 | 586.50 | 262.17 | 195.50 | 66.67 | 193.83 | 1500 | 500 |
| 4 | 981.33 | 781.33 | 245.33 | 195.33 | 50.00 | 194.83 | 2000 | 500 |
| 5 | 1179.17 | 979.17 | 235.83 | 195.83 | 40.00 | 197.83 | 2500 | 500 |
| 6 | 1382.00 | 1182.00 | 230.33 | 197.00 | 33.33 | 202.83 | 3000 | 500 |
| 7 | 1591.83 | 1391.83 | 227.40 | 198.83 | 28.57 | 209.83 | 3500 | 500 |
| 8 | 1810.67 | 1610.67 | 226.33 | 201.33 | 25.00 | 218.83 | 4000 | 500 |
| 9 | 2040.50 | 1840.50 | 226.72 | 204.50 | 22.22 | 229.83 | 4500 | 500 |
| 10 | 2283.33 | 2083.33 | 228.33 | 208.33 | 20.00 | 242.83 | 5000 | 500 |
| 11 | 2541.17 | 2341.17 | 231.02 | 212.83 | 18.18 | 257.83 | 5500 | 500 |
| 12 | 2816.00 | 2616.00 | 234.67 | 218.00 | 16.67 | 274.83 | 6000 | 500 |
| 13 | 3109.83 | 2909.83 | 239.22 | 223.83 | 15.38 | 293.83 | 6500 | 500 |
| 14 | 3424.67 | 3224.67 | 244.62 | 230.33 | 14.29 | 314.83 | 7000 | 500 |
| 15 | 3762.50 | 3562.50 | 250.83 | 237.50 | 13.33 | 337.83 | 7500 | 500 |
| 16 | 4125.33 | 3925.33 | 257.83 | 245.33 | 12.50 | 362.83 | 8000 | 500 |
| 17 | 4515.17 | 4315.17 | 265.60 | 253.83 | 11.76 | 389.83 | 8500 | 500 |
| 18 | 4934.00 | 4734.00 | 274.11 | 263.00 | 11.11 | 418.83 | 9000 | 500 |
| 19 | 5383.83 | 5183.83 | 283.36 | 272.83 | 10.53 | 449.83 | 9500 | 500 |
| 20 | 5866.67 | 5666.67 | 293.33 | 283.33 | 10.00 | 482.83 | 10000 | 500 |
| 21 | 6384.50 | 6184.50 | 304.02 | 294.50 | 9.52 | 517.83 | 10500 | 500 |
| 22 | 6939.33 | 6739.33 | 315.42 | 306.33 | 9.09 | 554.83 | 11000 | 500 |
| 23 | 7533.17 | 7333.17 | 327.53 | 318.83 | 8.70 | 593.83 | 11500 | 500 |
| 24 | 8168.00 | 7968.00 | 340.33 | 332.00 | 8.33 | 634.83 | 12000 | 500 |
| 25 | 8845.83 | 8645.83 | 353.83 | 345.83 | 8.00 | 677.83 | 12500 | 500 |
Formulas
Total Revenue = Q*10
Marginal Revenue = 10
Total Fixed Cost = 100
Total Variable cost = (2*Q)+(0.01*(Q^2))
Total Cost = Total Variable Cost + Total Fixed Cost
PROFIT= Total Revenue - Total Cost
(Replace Q with cell numbers on the excel sheet)
The profit max point is at 400 units
| Units | TR | MR | TVC | TFC | Total Cost | PROFIT |
| 100 | $ 1,000 | 10 | 300 | 100 | $ 400 | $ 600 |
| 110 | $ 1,100 | 10 | 341 | 100 | $ 441 | $ 659 |
| 120 | $ 1,200 | 10 | 384 | 100 | $ 484 | $ 716 |
| 130 | $ 1,300 | 10 | 429 | 100 | $ 529 | $ 771 |
| 140 | $ 1,400 | 10 | 476 | 100 | $ 576 | $ 824 |
| 150 | $ 1,500 | 10 | 525 | 100 | $ 625 | $ 875 |
| 160 | $ 1,600 | 10 | 576 | 100 | $ 676 | $ 924 |
| 170 | $ 1,700 | 10 | 629 | 100 | $ 729 | $ 971 |
| 180 | $ 1,800 | 10 | 684 | 100 | $ 784 | $ 1,016 |
| 190 | $ 1,900 | 10 | 741 | 100 | $ 841 | $ 1,059 |
| 200 | $ 2,000 | 10 | 800 | 100 | $ 900 | $ 1,100 |
| 210 | $ 2,100 | 10 | 861 | 100 | $ 961 | $ 1,139 |
| 220 | $ 2,200 | 10 | 924 | 100 | $ 1,024 | $ 1,176 |
| 230 | $ 2,300 | 10 | 989 | 100 | $ 1,089 | $ 1,211 |
| 240 | $ 2,400 | 10 | 1056 | 100 | $ 1,156 | $ 1,244 |
| 250 | $ 2,500 | 10 | 1125 | 100 | $ 1,225 | $ 1,275 |
| 260 | $ 2,600 | 10 | 1196 | 100 | $ 1,296 | $ 1,304 |
| 270 | $ 2,700 | 10 | 1269 | 100 | $ 1,369 | $ 1,331 |
| 280 | $ 2,800 | 10 | 1344 | 100 | $ 1,444 | $ 1,356 |
| 290 | $ 2,900 | 10 | 1421 | 100 | $ 1,521 | $ 1,379 |
| 300 | $ 3,000 | 10 | 1500 | 100 | $ 1,600 | $ 1,400 |
| 310 | $ 3,100 | 10 | 1581 | 100 | $ 1,681 | $ 1,419 |
| 320 | $ 3,200 | 10 | 1664 | 100 | $ 1,764 | $ 1,436 |
| 330 | $ 3,300 | 10 | 1749 | 100 | $ 1,849 | $ 1,451 |
| 340 | $ 3,400 | 10 | 1836 | 100 | $ 1,936 | $ 1,464 |
| 350 | $ 3,500 | 10 | 1925 | 100 | $ 2,025 | $ 1,475 |
| 360 | $ 3,600 | 10 | 2016 | 100 | $ 2,116 | $ 1,484 |
| 370 | $ 3,700 | 10 | 2109 | 100 | $ 2,209 | $ 1,491 |
| 380 | $ 3,800 | 10 | 2204 | 100 | $ 2,304 | $ 1,496 |
| 390 | $ 3,900 | 10 | 2301 | 100 | $ 2,401 | $ 1,499 |
| 400 | $ 4,000 | 10 | 2400 | 100 | $ 2,500 | $ 1,500 |
| 410 | $ 4,100 | 10 | 2501 | 100 | $ 2,601 | $ 1,499 |
| 420 | $ 4,200 | 10 | 2604 | 100 | $ 2,704 | $ 1,496 |
| 430 | $ 4,300 | 10 | 2709 | 100 | $ 2,809 | $ 1,491 |
| 440 | $ 4,400 | 10 | 2816 | 100 | $ 2,916 | $ 1,484 |
| 450 | $ 4,500 | 10 | 2925 | 100 | $ 3,025 | $ 1,475 |
| 460 | $ 4,600 | 10 | 3036 | 100 | $ 3,136 | $ 1,464 |
| 470 | $ 4,700 | 10 | 3149 | 100 | $ 3,249 | $ 1,451 |
| 480 | $ 4,800 | 10 | 3264 | 100 | $ 3,364 | $ 1,436 |
| 490 | $ 4,900 | 10 | 3381 | 100 | $ 3,481 | $ 1,419 |
| 500 | $ 5,000 | 10 | 3500 | 100 | $ 3,600 | $ 1,400 |
Add Answer to:
Follow the directions below to create an Excel graph for a perfectly competitive company. A company...
Consider a perfectly competitive market for shirts. The following graph shows the dally cost curves of a firm oper...
 Consider a perfectly competitive market for shirts. The following graph shows the dally cost curves of a firm operating in this market. PRICE, COST (Dollars per shirt 20 Profit or Loss MC 16 ATC 12 AVC 6 12 18 24 30 36 QUANTITY OF OUTPUTIThousands of shirts per dayl Help Clear AIL In the short run, at a market price of $18 per shirt, this firm will choose to produce 27.00 shirts per day On the previous graph, use the...
A company has received an order to manufacture 75 customized units of an entertainment cabinet. The...
A company has received an order to manufacture 75 customized units of an entertainment cabinet. The company is being offered $960 per cabinet and the CEO must decide whether or not to accept the order. An analysis of the production process for the cabinet reveals that a new, special-purpose lathe will be required. The estimated cost of the lathe is $14,400, although there is some uncertainty due to new tariffs. The variable cost is more difficult to estimate because the...
The graph below shows the TC and TVC curves of Galbraith's Globes Inc., a perfectly competitive...
 The graph below shows the TC and TVC curves of Galbraith's Globes Inc., a perfectly competitive firm. a. If the price is $20, draw the total revenue curve, and label it TR Plot only the endpoints of the curve below Once all points have been plotted click on the line (not individual points) and a tool icon will pop up. You can use this to enter exact co-ordinates for your points as needed. 0 TVC Tools Total revenue Total costs/revenues...
Create a calibration graph Make sure that on your data table appears the correct number of...
 Create a calibration graph
Make sure that on your data table appears the correct number of significant figures! Solution Blank (diH2O) Absorbance y 0 Concentration (grams/mL) X 0 0.3708 0.185 Stock Diluted Solution #1 0.595 A 0.303A 0.150 A 0.074 Diluted Solution #2 Diluted Solution #3 Unknown 0.093 0.047 To be determined using Calibration Graph 0.68A Plot 2 Calibration Graphs 1) Use graph paper (on page 26) to create a calibration graph by hand. (Instructions are on page 27.) 2)...
Create a calibration graph
Make sure that on your data table appears the correct number of significant figures! Solution Blank (diH2O) Absorbance y 0 Concentration (grams/mL) X 0 0.3708 0.185 Stock Diluted Solution #1 0.595 A 0.303A 0.150 A 0.074 Diluted Solution #2 Diluted Solution #3 Unknown 0.093 0.047 To be determined using Calibration Graph 0.68A Plot 2 Calibration Graphs 1) Use graph paper (on page 26) to create a calibration graph by hand. (Instructions are on page 27.) 2)...
SECTION NAME PRINT LAST NAME, FIRST NAME PERFECT COMPETITION Use the graph for a perfectly competitive...
 SECTION NAME PRINT LAST NAME, FIRST NAME PERFECT COMPETITION Use the graph for a perfectly competitive firm to answer questions 1 through 10. Price (P) MC 10.00 ATC 8.75 8.00 7.75 7.50 AVC 250 300 440 500 Quantity If price - $10, the profit-maximizing/loss-minimizing level of output is (1) total revenue is equal to (2) $_ -, total cost is equal to (3) $_ and the firm earns economic profit equal to (4) $_ If price = $7.50, the profit-maximizing/loss-minimizing...
Consider a perfectly competitive market for frylng pans. The following graph shows the dally cost curves...
 Consider a perfectly competitive market for frylng pans. The following graph shows the dally cost curves of a firm operating in this market. PRICE AND COST (Dollars per pan 20 Profit or Loss 16 ATC 12 AVC 10 20 30 450 60 OUTPUT IThousands of pans per day) Help Clear All In the short run, at a market price of $8 per pan, this firm will choose to produce pans per day. On the previous graph, use the blue rectangle...
Aply Yours 327 EA10-A2 Complete Budgets and a CVP Analysis for Gary's Housewares In this exercise,...
 Aply Yours 327 EA10-A2 Complete Budgets and a CVP Analysis for Gary's Housewares In this exercise, you will create budgets and perform CVP analyses for Gary's Housewares. You will first create a cash budget, adjusting settings to allow for efficient data examination. You will then create a purchases budget and adjust print settings. Lastly, you will perform CVP analyses using Goal Seek and Solver 1. Open EA10-A2-Budget from your Chapter 10 folder and save it as: EA10-A2-Budget-[YourName] 2. On the...
One-Variable Data Table Your maximum weekly production capability is 200 gallons. You would like to create...
One-Variable Data Table Your maximum weekly production capability is 200 gallons. You would like to create a one-variable data table to measure the impact of Production Cost, Gross Profit, and Net Profit based on selling between 10 and 200 gallons of paint within a week. a. Start in cell E3. Complete the series of substitution values ranging from 10 to 200 at increments of 10 gallons vertically down column E. b. Enter references to the Total Production Cost, Gross Profit,...
Instructions 1-17 sheet 1 sheet 2 Should be done on exel file. Assignment Instructions Step Instructions...
 Instructions 1-17
sheet 1
sheet
2
Should be done on exel file.
Assignment Instructions Step Instructions Point Value Open the Excel file Student_Excel_2F_Bonus xlsx downloaded with this project. Rename Sheet1 as Northern and rename Sheet2 as Southern Click the Northern sheet tab to make it the active sheet, and then group the worksheets. In cell A1, type Rosedale Landscape and Garden and then Merge & Center the text across the range A1 F1. Apply the Title cell style. Merge &...
Instructions 1-17
sheet 1
sheet
2
Should be done on exel file.
Assignment Instructions Step Instructions Point Value Open the Excel file Student_Excel_2F_Bonus xlsx downloaded with this project. Rename Sheet1 as Northern and rename Sheet2 as Southern Click the Northern sheet tab to make it the active sheet, and then group the worksheets. In cell A1, type Rosedale Landscape and Garden and then Merge & Center the text across the range A1 F1. Apply the Title cell style. Merge &...
I have completed these but wanting to compare such as Question 14. Is the word "Total"...
I have completed these but wanting to compare such as Question 14. Is the word "Total" added in the row or written as "Average" or "Total Average" Also Question 8 is not clear what fill color. Is it supposed to stay as blue and just select gradient fill? Very unclear questions. Thank you. Question: EX16_XL_VOL1_GRADER_CAP_AS – Travel Vacations 1.4 ( Excel, Chapter 4) Project Description: 1 Start Excel. Download and open the file named exploring_ecap_grader_a1.xlsx. 2 On the DC worksheet,...
 Consider a perfectly competitive market for shirts. The following graph shows the dally cost curves of a firm operating in this market. PRICE, COST (Dollars per shirt 20 Profit or Loss MC 16 ATC 12 AVC 6 12 18 24 30 36 QUANTITY OF OUTPUTIThousands of shirts per dayl Help Clear AIL In the short run, at a market price of $18 per shirt, this firm will choose to produce 27.00 shirts per day On the previous graph, use the...
 The graph below shows the TC and TVC curves of Galbraith's Globes Inc., a perfectly competitive firm. a. If the price is $20, draw the total revenue curve, and label it TR Plot only the endpoints of the curve below Once all points have been plotted click on the line (not individual points) and a tool icon will pop up. You can use this to enter exact co-ordinates for your points as needed. 0 TVC Tools Total revenue Total costs/revenues...
 Create a calibration graph
Make sure that on your data table appears the correct number of significant figures! Solution Blank (diH2O) Absorbance y 0 Concentration (grams/mL) X 0 0.3708 0.185 Stock Diluted Solution #1 0.595 A 0.303A 0.150 A 0.074 Diluted Solution #2 Diluted Solution #3 Unknown 0.093 0.047 To be determined using Calibration Graph 0.68A Plot 2 Calibration Graphs 1) Use graph paper (on page 26) to create a calibration graph by hand. (Instructions are on page 27.) 2)...
Create a calibration graph
Make sure that on your data table appears the correct number of significant figures! Solution Blank (diH2O) Absorbance y 0 Concentration (grams/mL) X 0 0.3708 0.185 Stock Diluted Solution #1 0.595 A 0.303A 0.150 A 0.074 Diluted Solution #2 Diluted Solution #3 Unknown 0.093 0.047 To be determined using Calibration Graph 0.68A Plot 2 Calibration Graphs 1) Use graph paper (on page 26) to create a calibration graph by hand. (Instructions are on page 27.) 2)...
 SECTION NAME PRINT LAST NAME, FIRST NAME PERFECT COMPETITION Use the graph for a perfectly competitive firm to answer questions 1 through 10. Price (P) MC 10.00 ATC 8.75 8.00 7.75 7.50 AVC 250 300 440 500 Quantity If price - $10, the profit-maximizing/loss-minimizing level of output is (1) total revenue is equal to (2) $_ -, total cost is equal to (3) $_ and the firm earns economic profit equal to (4) $_ If price = $7.50, the profit-maximizing/loss-minimizing...
 Consider a perfectly competitive market for frylng pans. The following graph shows the dally cost curves of a firm operating in this market. PRICE AND COST (Dollars per pan 20 Profit or Loss 16 ATC 12 AVC 10 20 30 450 60 OUTPUT IThousands of pans per day) Help Clear All In the short run, at a market price of $8 per pan, this firm will choose to produce pans per day. On the previous graph, use the blue rectangle...
 Aply Yours 327 EA10-A2 Complete Budgets and a CVP Analysis for Gary's Housewares In this exercise, you will create budgets and perform CVP analyses for Gary's Housewares. You will first create a cash budget, adjusting settings to allow for efficient data examination. You will then create a purchases budget and adjust print settings. Lastly, you will perform CVP analyses using Goal Seek and Solver 1. Open EA10-A2-Budget from your Chapter 10 folder and save it as: EA10-A2-Budget-[YourName] 2. On the...
 Instructions 1-17
sheet 1
sheet
2
Should be done on exel file.
Assignment Instructions Step Instructions Point Value Open the Excel file Student_Excel_2F_Bonus xlsx downloaded with this project. Rename Sheet1 as Northern and rename Sheet2 as Southern Click the Northern sheet tab to make it the active sheet, and then group the worksheets. In cell A1, type Rosedale Landscape and Garden and then Merge & Center the text across the range A1 F1. Apply the Title cell style. Merge &...
Instructions 1-17
sheet 1
sheet
2
Should be done on exel file.
Assignment Instructions Step Instructions Point Value Open the Excel file Student_Excel_2F_Bonus xlsx downloaded with this project. Rename Sheet1 as Northern and rename Sheet2 as Southern Click the Northern sheet tab to make it the active sheet, and then group the worksheets. In cell A1, type Rosedale Landscape and Garden and then Merge & Center the text across the range A1 F1. Apply the Title cell style. Merge &...
Most questions answered within 3 hours.
-
Where is the error in this code sequence?
String s1 = "Hello";
String s2 = "ello";...
asked 10 months ago -
Financial data for Joel de Paris, Inc., for last year
follow:
Joel de Paris, Inc.
Balance...
asked 10 months ago -
Consider this reaction:
Al2(SO4)3 (aq)+ BaCl3
(aq) Al2Cl6 (aq)- +
3BaSO4(s) . What is the...
asked 10 months ago -
Suppose that Savneet is considering increasing her
recent random sample from 20 car rentals to 40...
asked 10 months ago -
Trucks arrive at an unloading terminal at an average rate of 120
per hour.
Trucks arrive...
asked 10 months ago -
Why are methanol and ethanol completely soluble in water while
octanol is not very little soluble....
asked 10 months ago -
A facilities manager at a university reads in a research report
that the mean amount of...
asked 10 months ago -
When the CuSO4 is rehydrated by adding water to the anhydrous
compound, is this an endothermic...
asked 10 months ago -
A ray of sunlight is passing from diamond into crown glass; the
angle of incidence is...
asked 10 months ago -
A block of mass 0.249 kg is placed on top of a light, vertical
spring of...
asked 10 months ago -
how do the kidneys compensate in the presences of acidosis
a) trigger hyperventilate
b) reserve acid...
asked 10 months ago -
Question 501 pts
The rental rate of capital to the firm increases. Which of the
following...
asked 10 months ago