

Homework Answers
Part a.
Using Minitab:
1. With the raw data entered in C1,
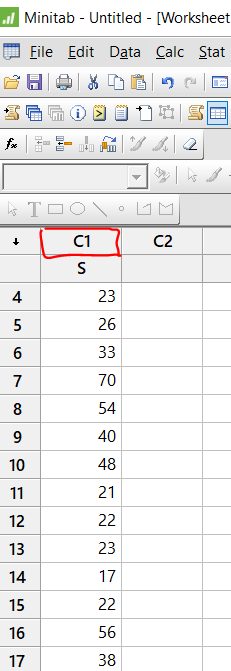
select the Graph menu and highlight Stem-and-Leaf.
Select the data in C1 and press OK
2. Select the data in C1 and press OK.
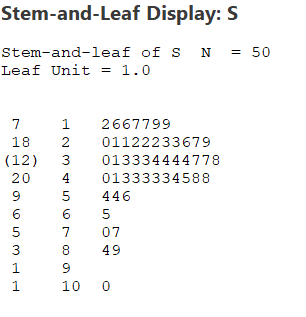
Part b.


Part c.
Consider the given data, (Sample size,n=50)
12 16 16 17 17 19 19 20 21 21 22 22 22 23 23 26 27 29 30 31 33 33 33 34 34 34 34 37 37 38 40 41 43 43 43 43 43 44 45 48 48 54 54 56 65 70 77 84 89 100
The given data is already arranged from smallest to largest.
The trimmed mean, as the name suggests that we have to trim some of the observation from the given data. The percentage is given, we have to trimmed 10% of the data.
10% trimmed of the data is performed as,
trimmed percentage * sample size
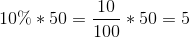
it means, the 10% trimmed of the data will remove 5 observation from the bottom and 4 observation from the top of the data.
12 16 16 17 17 19 19 20 21 21 22 22 22 23 23 26 27 29 30 31 33 33 33 34 34 34 34 37 37 38 40 41 43 43 43 43 43 44 45 48 48 54 54 56 65 70 77 84 89 100
So, the trimmed new data is, (Sample size, n=40)
19 20 21 21 22 22 22 23 23 26 27 29 30 31 33 33 33 34 34 34 34 37 37 38 40 41 43 43 43 43 43 44 45 48 48 54 54 56 65
and trimmed mean is,

Therefore, the 10% trimmed mean is 35.3
Please post the other questions separately. As per our answering
guidelines, we are supposed to answer just one question or four sub
parts of the same question.
Hope this will be helpful. Thanks and God Bless You:) If
any query in the solution, please post in comments
A data set of 50 comprehension scores is included below. Please answer the following questions and/or...
A data set of 50 comprehension scores is included below. Please answer the following questions and/or complete the following tasks. 12, 15, 11, 16, 21, 25, 21, 8, 6, 2, 22, 26, 27, 36, 34, 33, 38, 42, 44, 47, 54, 55, 45, 56, 53, 57, 45, 45, 45, 47, 43, 31, 12, 14, 15, 16, 22, 29, 54, 56, 57, 59, 54, 56, 43, 44, 41, 42, 7, 29 1. Create a frequency distribution for the data set using...
These are my instructions: Your data should have been read in from the data file and stored into ...
These are my instructions: Your data should have been read in from the data file and stored into an array. Next you need to calculate the following and display in a single Message box: Average score Highest score Lowest score Mode of the scores Your program should be written using methods and should be well documented internally and externally. Your output should be displayed using Message boxes. This is the .text file to use with the instructions: 20 21 22...
1. Descriptive Statistics Data 20 25 40 41 42 43 44 45 46 47 48 49...
 1. Descriptive Statistics Data 20 25 40 41 42 43 44 45 46 47 48 49 50 50 51 52 53 54 55 56 57 58 59 60 65 80 90 For the data above calculate and draw the following: a. A Frequency Diagram with 7 classes. b. A Histogram C. A Stem and Leaf Diagram. Don't forget the instruction. d. The Five Number Summary e. The Box and Whisker Plot which needs the IQR, the Lower Fence and Upper...
Below are the times (in days) it takes for a sample of 22 customers from Jack's...
 Below are the times (in days) it takes for a sample of 22 customers from Jack's computer store to pay their invoices. 19, 15, 43, 39, 35, 31, 27, 22, 18, 14, 42, 38, 34, 30, 26, 21, 37, 37, 37, 33, 33, 33 Draw the histogram for these data using an initial class boundary of 13.5, an ending class boundary of 48.5, and 5 classes of equal width. Note that you can add or remove classes from the figure....
For each variable of interest – Percent Time Asleep and Longevity – create a grouped frequency...
For each variable of interest – Percent Time Asleep and Longevity – create a grouped frequency histogram. For each histogram, use a class width of 10; use a lower limit of 0 for Percent Time Asleep and 15 for Longevity. Each histogram must include an informative title, along with correct labels for both axes. For each histogram, include a paragraph that answers each of the following questions: Is the histogram symmetric, skewed to the left, or skewed to the right?...
2:33 LTE X Statistics first homework.pdf 1 Descriptive Statistics Data 20 25 40 41 42 43...
 2:33 LTE X Statistics first homework.pdf 1 Descriptive Statistics Data 20 25 40 41 42 43 44 45 46 47 48 49 50 50 51 52 53 54 55 56 57 58 59 60 65 80 90 For the data above calculate and draw the following: a. A Frequency Diagram with 7 classes b.A Histogram A Stem and Leaf Diagram. Don't forget the instruction d. The Five Number Summary e. The Box and Whisker Plot which needs the IQR, the...
For Questions 1-2, use table below. It is data for two stocks over 30 days (it...
For Questions 1-2, use table below. It is data for two stocks over 30 days (it is sample data). Day High stock Sky stock Day High stock Sky stock 1 27 60 16 43 39 2 33 57 17 45 37 3 34 56 18 46 35 4 35 55 19 47 34 5 36 54 20 47 32 6 37 51 21 48 29 7 38 50 22 50 26 8 38 47 23 50 26 9 39 47...
Sample Data Sample Data Hour Sample Taken Hour Sample Taken 1 4 5 X 1 3...
 Sample Data Sample Data Hour Sample Taken Hour Sample Taken 1 4 5 X 1 3 1 42 2 3 4 5 6 2 39 36 25 60 28 53 22 56 41 34 43 45 59 42 36 40 45 39 48 26 42 34 61 48 45 29 3 31 61 38 40 54 26 38 42 37 41 53 37 47 41 37 29 20 26 43 38 33 37 37 35 33 36 41 25 37...
느 - K L M N O Р Q R S B с D E F...
 느 - K L M N O Р Q R S B с D E F G H 4 A sample of households provided the following information about their Per Capita Income. 5 Use Excel to construct a percent frequency distribution table and graph. 6 Provide an appropriate label for each of the horizontal and vertical axes. 7 Make your first class "30,000-34,999" 8 Place the frequency distribution table and histogram within the highlighted box below. 9 Per Capita 10...
s Question Completion Status: For the following data set, 5,9, 12, 15, 19, 21, 22, 22,...
 s Question Completion Status: For the following data set, 5,9, 12, 15, 19, 21, 22, 22, 24, 26, 27,27, 31, 33, 33, 34, 37,38, 60,70 a) Find the quartiles 91 Q2 Q3 c) Find the interquartile tange (IQR) IQR- d) Find the lower limit LL = e) Find the upper limit ) identify the potential outiers (Separate each outlier with The potential outlier(s) are
 1. Descriptive Statistics Data 20 25 40 41 42 43 44 45 46 47 48 49 50 50 51 52 53 54 55 56 57 58 59 60 65 80 90 For the data above calculate and draw the following: a. A Frequency Diagram with 7 classes. b. A Histogram C. A Stem and Leaf Diagram. Don't forget the instruction. d. The Five Number Summary e. The Box and Whisker Plot which needs the IQR, the Lower Fence and Upper...
 Below are the times (in days) it takes for a sample of 22 customers from Jack's computer store to pay their invoices. 19, 15, 43, 39, 35, 31, 27, 22, 18, 14, 42, 38, 34, 30, 26, 21, 37, 37, 37, 33, 33, 33 Draw the histogram for these data using an initial class boundary of 13.5, an ending class boundary of 48.5, and 5 classes of equal width. Note that you can add or remove classes from the figure....
 2:33 LTE X Statistics first homework.pdf 1 Descriptive Statistics Data 20 25 40 41 42 43 44 45 46 47 48 49 50 50 51 52 53 54 55 56 57 58 59 60 65 80 90 For the data above calculate and draw the following: a. A Frequency Diagram with 7 classes b.A Histogram A Stem and Leaf Diagram. Don't forget the instruction d. The Five Number Summary e. The Box and Whisker Plot which needs the IQR, the...
 Sample Data Sample Data Hour Sample Taken Hour Sample Taken 1 4 5 X 1 3 1 42 2 3 4 5 6 2 39 36 25 60 28 53 22 56 41 34 43 45 59 42 36 40 45 39 48 26 42 34 61 48 45 29 3 31 61 38 40 54 26 38 42 37 41 53 37 47 41 37 29 20 26 43 38 33 37 37 35 33 36 41 25 37...
 느 - K L M N O Р Q R S B с D E F G H 4 A sample of households provided the following information about their Per Capita Income. 5 Use Excel to construct a percent frequency distribution table and graph. 6 Provide an appropriate label for each of the horizontal and vertical axes. 7 Make your first class "30,000-34,999" 8 Place the frequency distribution table and histogram within the highlighted box below. 9 Per Capita 10...
 s Question Completion Status: For the following data set, 5,9, 12, 15, 19, 21, 22, 22, 24, 26, 27,27, 31, 33, 33, 34, 37,38, 60,70 a) Find the quartiles 91 Q2 Q3 c) Find the interquartile tange (IQR) IQR- d) Find the lower limit LL = e) Find the upper limit ) identify the potential outiers (Separate each outlier with The potential outlier(s) are
Most questions answered within 3 hours.
-
Where is the error in this code sequence?
String s1 = "Hello";
String s2 = "ello";...
asked 11 months ago -
Financial data for Joel de Paris, Inc., for last year
follow:
Joel de Paris, Inc.
Balance...
asked 11 months ago -
Consider this reaction:
Al2(SO4)3 (aq)+ BaCl3
(aq) Al2Cl6 (aq)- +
3BaSO4(s) . What is the...
asked 11 months ago -
Suppose that Savneet is considering increasing her
recent random sample from 20 car rentals to 40...
asked 11 months ago -
Trucks arrive at an unloading terminal at an average rate of 120
per hour.
Trucks arrive...
asked 11 months ago -
Why are methanol and ethanol completely soluble in water while
octanol is not very little soluble....
asked 11 months ago -
A facilities manager at a university reads in a research report
that the mean amount of...
asked 11 months ago -
When the CuSO4 is rehydrated by adding water to the anhydrous
compound, is this an endothermic...
asked 11 months ago -
A ray of sunlight is passing from diamond into crown glass; the
angle of incidence is...
asked 11 months ago -
A block of mass 0.249 kg is placed on top of a light, vertical
spring of...
asked 11 months ago -
how do the kidneys compensate in the presences of acidosis
a) trigger hyperventilate
b) reserve acid...
asked 11 months ago -
Question 501 pts
The rental rate of capital to the firm increases. Which of the
following...
asked 11 months ago