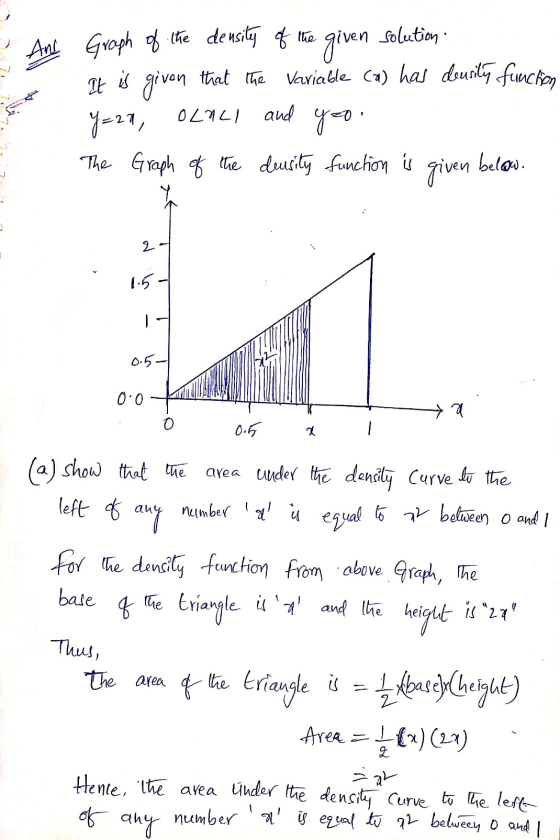
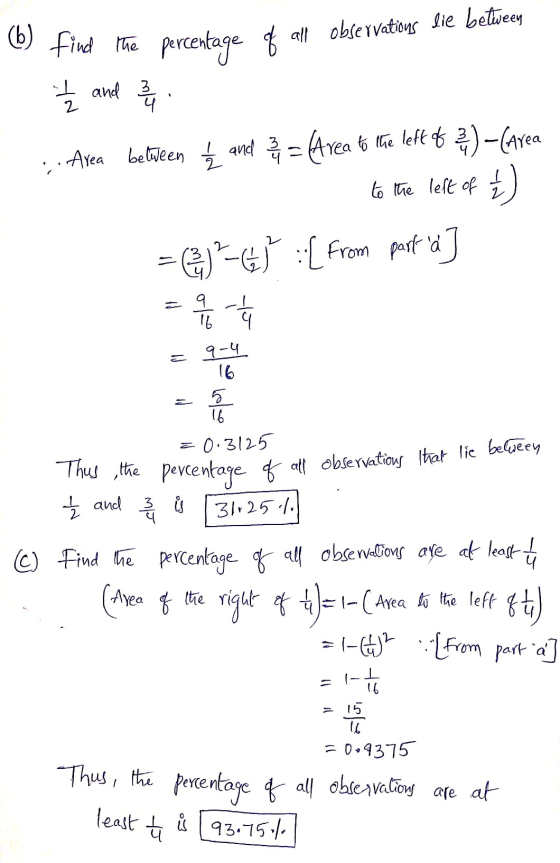
A variable has the density curve whose equation is ? = 2? for 0 < x...
Homework Answers
Add Answer to:
A variable has the density curve whose equation is ? = 2? for
0 < x...
Score: 0 of 1 pt 9 of 13 (10 complete) ic: X 6.3.91 A variable is...
 Score: 0 of 1 pt 9 of 13 (10 complete) ic: X 6.3.91 A variable is normally distributed with mean 15 and standard deviation 4. a. Find the percentage of all possible values of the variable that lie between 5 and 17. b. Find the percentage of all possible values of the variable that are at least 13. c. Find the percentage of all possible values of the variable that are at most 7. Click here to view page 1...
Name: 1. Given that the area under the density curve that lies to the left of...
 Name: 1. Given that the area under the density curve that lies to the left of 25 is 0.483. What percentage of all possible observations of the variable are at least 25?
answer these 3 thank you very much се Assume that the variable under consideration has a...
 answer these 3 thank you very much
се Assume that the variable under consideration has a density curve. The area under the density curve that lies to the right of 18 is 0.389. a. What percentage of all possible observations of the variable exceed 18? b. What percentage of all possible observations of the variable are at most 18? A: a. St (Type an integer or a decimal.) GI b. 1.9 Question Help Assume that the variable under consideration has...
answer these 3 thank you very much
се Assume that the variable under consideration has a density curve. The area under the density curve that lies to the right of 18 is 0.389. a. What percentage of all possible observations of the variable exceed 18? b. What percentage of all possible observations of the variable are at most 18? A: a. St (Type an integer or a decimal.) GI b. 1.9 Question Help Assume that the variable under consideration has...
1. Use a standard normal table to obtain the areas under the normal curve described below....
1. Use a standard normal table to obtain the areas under the normal curve described below. Sketch a standard normal curve and shade the area of interest. a. The area either to the left of negative 1.71 or to the right of 1.09. b. The area either to the left of 0.58 or to the right of 1.63. 2. A variable is normally distributed with mean 13 and standard deviation 4 a. Find the percentage of all possible values of...
The area under a particular normal curve between 12 and 20 is 0.9744. A normally distributed...
The area under a particular normal curve between 12 and 20 is 0.9744. A normally distributed variable has the same mean and standard deviation as the parameters for this normal curve. What percentage of all possible observations of the variable lie between 12 and 20? nothing% of all observations of the variable lie between 12 and 20.
Consider the random variable Y, whose probability density function is defined as: if 0 y1 2 y if 1 y < 2 fr(v) 0 oth...
 Consider the random variable Y, whose probability density function is defined as: if 0 y1 2 y if 1 y < 2 fr(v) 0 otherwise (a) Determine the moment generating function of Y (b) Suppose the random variables X each have a continuous uniform distribution on [0,1 for i 1,2. Show that the random variable Z X1X2 has the same distribution = as the random variable Y defined above.
Consider the random variable Y, whose probability density function is defined...
Consider the random variable Y, whose probability density function is defined as: if 0 y1 2 y if 1 y < 2 fr(v) 0 otherwise (a) Determine the moment generating function of Y (b) Suppose the random variables X each have a continuous uniform distribution on [0,1 for i 1,2. Show that the random variable Z X1X2 has the same distribution = as the random variable Y defined above.
Consider the random variable Y, whose probability density function is defined...
Let X be a continuous random variable whose probability density function is fax) (2x +af (0...
 Let X be a continuous random variable whose probability density function is fax) (2x +af (0 1) if x E (0; 1) f (x) - ind 1) the coefficient a; 2) P(0.5<X<0.7); 3) P(X 3) Part 3 sample of measurements is given XI-8 -210|2|8 Y 8 4 2 2 0
4) Provide an appropriate response. 4) The area under the standard normal curve between 1 and...
 4) Provide an appropriate response. 4) The area under the standard normal curve between 1 and 2 is equal to 0.1359. Scores on a particular aptitude test are normally distributed with a mean of 100 and a standard deviation of 10. Which of the following are equal to 13.59%? a. The percentage of scores between 120 and 130 b. The percentage of scores between 110 and 120 c. The percentage of scores between 80 and 90 d. The percentage of...
Let X be a random variable with the probability density function f(x)= x^3/4 for an interval...
 Let X be a random variable with the probability density function f(x)= x^3/4 for an interval 0<x<2 (a) What is the support of X? (b) Letting S be the support of X, pick two numbers a, b e S and compute Pa<x<b). Draw a graph that shows an area under the curve y = f() that is equal to this probability. (c) What is Fx (2)? Draw a good graph of y=Fx (I). (d) What is EX? (e) What is...
6. Let X be a continuous random variable whose probability density function is: 0, x <0,...
 6. Let X be a continuous random variable whose probability density function is: 0, x <0, x20.5 Find the median un the mode. 7. Let X be a continuous random variable whose cumulative distribution function is: F(x) = 0.1x, ja 0S$s10, Find 1) the densitv function of random variable U-12-X. 0, ja x<0, I, ja x>10.
 Score: 0 of 1 pt 9 of 13 (10 complete) ic: X 6.3.91 A variable is normally distributed with mean 15 and standard deviation 4. a. Find the percentage of all possible values of the variable that lie between 5 and 17. b. Find the percentage of all possible values of the variable that are at least 13. c. Find the percentage of all possible values of the variable that are at most 7. Click here to view page 1...
 Name: 1. Given that the area under the density curve that lies to the left of 25 is 0.483. What percentage of all possible observations of the variable are at least 25?
 answer these 3 thank you very much
се Assume that the variable under consideration has a density curve. The area under the density curve that lies to the right of 18 is 0.389. a. What percentage of all possible observations of the variable exceed 18? b. What percentage of all possible observations of the variable are at most 18? A: a. St (Type an integer or a decimal.) GI b. 1.9 Question Help Assume that the variable under consideration has...
answer these 3 thank you very much
се Assume that the variable under consideration has a density curve. The area under the density curve that lies to the right of 18 is 0.389. a. What percentage of all possible observations of the variable exceed 18? b. What percentage of all possible observations of the variable are at most 18? A: a. St (Type an integer or a decimal.) GI b. 1.9 Question Help Assume that the variable under consideration has...
 Consider the random variable Y, whose probability density function is defined as: if 0 y1 2 y if 1 y < 2 fr(v) 0 otherwise (a) Determine the moment generating function of Y (b) Suppose the random variables X each have a continuous uniform distribution on [0,1 for i 1,2. Show that the random variable Z X1X2 has the same distribution = as the random variable Y defined above.
Consider the random variable Y, whose probability density function is defined...
Consider the random variable Y, whose probability density function is defined as: if 0 y1 2 y if 1 y < 2 fr(v) 0 otherwise (a) Determine the moment generating function of Y (b) Suppose the random variables X each have a continuous uniform distribution on [0,1 for i 1,2. Show that the random variable Z X1X2 has the same distribution = as the random variable Y defined above.
Consider the random variable Y, whose probability density function is defined...
 Let X be a continuous random variable whose probability density function is fax) (2x +af (0 1) if x E (0; 1) f (x) - ind 1) the coefficient a; 2) P(0.5<X<0.7); 3) P(X 3) Part 3 sample of measurements is given XI-8 -210|2|8 Y 8 4 2 2 0
 4) Provide an appropriate response. 4) The area under the standard normal curve between 1 and 2 is equal to 0.1359. Scores on a particular aptitude test are normally distributed with a mean of 100 and a standard deviation of 10. Which of the following are equal to 13.59%? a. The percentage of scores between 120 and 130 b. The percentage of scores between 110 and 120 c. The percentage of scores between 80 and 90 d. The percentage of...
 Let X be a random variable with the probability density function f(x)= x^3/4 for an interval 0<x<2 (a) What is the support of X? (b) Letting S be the support of X, pick two numbers a, b e S and compute Pa<x<b). Draw a graph that shows an area under the curve y = f() that is equal to this probability. (c) What is Fx (2)? Draw a good graph of y=Fx (I). (d) What is EX? (e) What is...
 6. Let X be a continuous random variable whose probability density function is: 0, x <0, x20.5 Find the median un the mode. 7. Let X be a continuous random variable whose cumulative distribution function is: F(x) = 0.1x, ja 0S$s10, Find 1) the densitv function of random variable U-12-X. 0, ja x<0, I, ja x>10.
Most questions answered within 3 hours.
-
Where is the error in this code sequence?
String s1 = "Hello";
String s2 = "ello";...
asked 10 months ago -
Financial data for Joel de Paris, Inc., for last year
follow:
Joel de Paris, Inc.
Balance...
asked 10 months ago -
Consider this reaction:
Al2(SO4)3 (aq)+ BaCl3
(aq) Al2Cl6 (aq)- +
3BaSO4(s) . What is the...
asked 10 months ago -
Suppose that Savneet is considering increasing her
recent random sample from 20 car rentals to 40...
asked 10 months ago -
Trucks arrive at an unloading terminal at an average rate of 120
per hour.
Trucks arrive...
asked 10 months ago -
Why are methanol and ethanol completely soluble in water while
octanol is not very little soluble....
asked 10 months ago -
A facilities manager at a university reads in a research report
that the mean amount of...
asked 10 months ago -
When the CuSO4 is rehydrated by adding water to the anhydrous
compound, is this an endothermic...
asked 10 months ago -
A ray of sunlight is passing from diamond into crown glass; the
angle of incidence is...
asked 10 months ago -
A block of mass 0.249 kg is placed on top of a light, vertical
spring of...
asked 10 months ago -
how do the kidneys compensate in the presences of acidosis
a) trigger hyperventilate
b) reserve acid...
asked 10 months ago -
Question 501 pts
The rental rate of capital to the firm increases. Which of the
following...
asked 10 months ago