
|
n |
α=0.05 |
α=0.01 |
NOTE: To test
H0: ρ=0 againstH1: ρ≠0, rejectH0 if the absolute value of r is greater than the critical value in the table. |
|---|---|---|---|
|
4 |
0.950 |
0.990 |
|
|
5 |
0.878 |
0.959 |
|
|
6 |
0.811 |
0.917 |
|
|
7 |
0.754 |
0.875 |
|
|
8 |
0.707 |
0.834 |
|
|
9 |
0.666 |
0.798 |
|
|
10 |
0.632 |
0.765 |
|
|
11 |
0.602 |
0.735 |
|
|
12 |
0.576 |
0.708 |
|
|
13 |
0.553 |
0.684 |
|
|
14 |
0.532 |
0.661 |
|
|
15 |
0.514 |
0.641 |
|
|
16 |
0.497 |
0.623 |
|
|
17 |
0.482 |
0.606 |
|
|
18 |
0.468 |
0.590 |
|
|
19 |
0.456 |
0.575 |
|
|
20 |
0.444 |
0.561 |
|
|
25 |
0.396 |
0.505 |
|
|
30 |
0.361 |
0.463 |
|
|
35 |
0.335 |
0.430 |
|
|
40 |
0.312 |
0.402 |
|
|
45 |
0.294 |
0.378 |
|
|
50 |
0.279 |
0.361 |
|
|
60 |
0.254 |
0.330 |
|
|
70 |
0.236 |
0.305 |
|
|
80 |
0.220 |
0.286 |
|
|
90 |
0.207 |
0.269 |
|
|
100 |
0.196 |
0.256 |
|
|
n |
α=0.05 |
α=0.01 |
Homework Answers
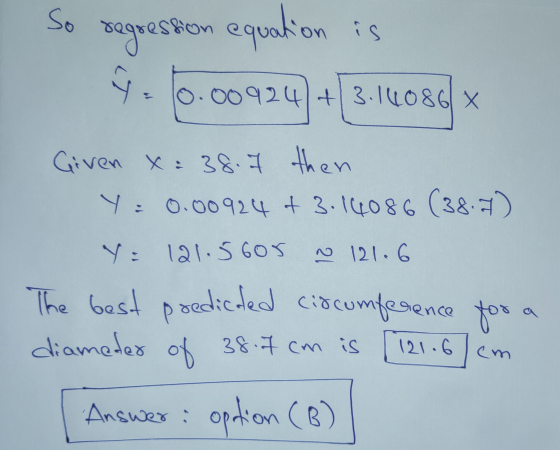
For the given data using Regression in Excel we get output as
| SUMMARY OUTPUT | ||||||
| Regression Statistics | ||||||
| Multiple R | 0.9999996 | |||||
| R Square | 0.9999992 | |||||
| Adjusted R Square | 0.99999904 | |||||
| Standard Error | 0.027980746 | |||||
| Observations | 7 | |||||
| ANOVA | ||||||
| df | SS | MS | F | Significance F | ||
| Regression | 1 | 4894.513228 | 4894.513 | 6251596 | 1.94234E-16 | |
| Residual | 5 | 0.003914611 | 0.000783 | |||
| Total | 6 | 4894.517143 | ||||
| Coefficients | Standard Error | t Stat | P-value | Lower 95% | Upper 95% | |
| Intercept | 0.00923744 | 0.019260396 | 0.479608 | 0.65175 | -0.040272985 | 0.058747866 |
| x | 3.140862184 | 0.001256184 | 2500.319 | 1.94E-16 | 3.137633059 | 3.144091309 |
From the above output
Add Answer to:
Critical Values of the Pearson Correlation Coefficient
r
n
α=0.05
α=0.01
NOTE: To test
H0:
ρ=0...
n α=0.05 α=0.01 NOTE: To test H0: ρ=0 against H1: ρ≠0, reject H0 if the absolute...
 n
α=0.05
α=0.01
NOTE: To test
H0:
ρ=0
against
H1:
ρ≠0,
reject
H0
if the absolute value of r is greater than the critical value in
the table.
4
0.950
0.990
5
0.878
0.959
6
0.811
0.917
7
0.754
0.875
8
0.707
0.834
9
0.666
0.798
10
0.632
0.765
11
0.602
0.735
12
0.576
0.708
13
0.553
0.684
14
0.532
0.661
15
0.514
0.641
16
0.497
0.623
17
0.482
0.606
18
0.468
0.590
19
0.456
0.575
20
0.444
0.561
25...
n
α=0.05
α=0.01
NOTE: To test
H0:
ρ=0
against
H1:
ρ≠0,
reject
H0
if the absolute value of r is greater than the critical value in
the table.
4
0.950
0.990
5
0.878
0.959
6
0.811
0.917
7
0.754
0.875
8
0.707
0.834
9
0.666
0.798
10
0.632
0.765
11
0.602
0.735
12
0.576
0.708
13
0.553
0.684
14
0.532
0.661
15
0.514
0.641
16
0.497
0.623
17
0.482
0.606
18
0.468
0.590
19
0.456
0.575
20
0.444
0.561
25...
Find the regression equation, letting the diameter be the predictor (x) variable. Find the best predicted...
Find the regression equation, letting the diameter be the predictor (x) variable. Find the best predicted circumference of a marblemarble with a diameter of 1.7 cm. How does the result compare to the actual circumference of 5.3 cm? Use a significance level of 0.05 _ Diameter Circumference Baseball 7.4 23.2 Basketball 24.4 76.7 Golf 4.2 13.2 Soccer 21.9 68.8 Tennis 7.0 22.0 Ping-Pong 4.0 12.6 Volleyball 20.9 65.7 The regression equation is ModifyingAbove y with caretyequals=nothingplus+nothingx. (Round to five decimal...
Find the regression equation, letting the diameter be the predictor (x) variable. Find the best predicted...
Find the regression equation, letting the diameter be the predictor (x) variable. Find the best predicted circumference of a beachball with a diameter of 44.6 cm. How does the result compare to the actual circumference of 140.1 cm? Use a significance level of 0.05. Find the regression equation, letting the diameter be the predictor (x) variable. Find the best predicted circumference of a beachball with a diameter of 44.6 cm. How does the result compare to the actual circumference of...
please answer all parts 1 Critical Values of the Pearson Correlation Coefficient Critical Values of the...
 please answer all parts
1 Critical Values of the Pearson Correlation Coefficient Critical Values of the Pearson Correlation coefficient a = 0.05 a = 0.01 0.950 10.990 0.878 0.959 0.811 0.917 0.754 0.875 0.707 0.834 0.666 10.798 0.632 0.765 0.602 0.735 0.576 0.708 0.553 0.684 0.532 0.661 0.514 0.641 0.497 0.623 0.482 0.606 0.468 10.590 0.456 0.575 0.444 0.561 0.396 0.505 10.361 10.463 sand Print Done 17 18 19 0.402 0.468 0.590 0.456 10.575 0.444 0.561 0.396 0.505 0.361 0.463...
please answer all parts
1 Critical Values of the Pearson Correlation Coefficient Critical Values of the Pearson Correlation coefficient a = 0.05 a = 0.01 0.950 10.990 0.878 0.959 0.811 0.917 0.754 0.875 0.707 0.834 0.666 10.798 0.632 0.765 0.602 0.735 0.576 0.708 0.553 0.684 0.532 0.661 0.514 0.641 0.497 0.623 0.482 0.606 0.468 10.590 0.456 0.575 0.444 0.561 0.396 0.505 10.361 10.463 sand Print Done 17 18 19 0.402 0.468 0.590 0.456 10.575 0.444 0.561 0.396 0.505 0.361 0.463...
Find the regression equation letting overhead with be the predictor(s) variable. Find the best predicted weight...
 Find the regression equation letting overhead with be the predictor(s) variable. Find the best predicted weight of a seal the overhead width moured from a photograph is 16 cm. Can the prediction be correct? What is wrong with predicting the weight in this case? Use a significance level of 0.05. Overhead Width (cm) 84 79 82 7.8 Weight (kg) 201 209 190 181 200 Click the loon to view the critical values of the Pearson correlation coeficient The regression equation...
 n
α=0.05
α=0.01
NOTE: To test
H0:
ρ=0
against
H1:
ρ≠0,
reject
H0
if the absolute value of r is greater than the critical value in
the table.
4
0.950
0.990
5
0.878
0.959
6
0.811
0.917
7
0.754
0.875
8
0.707
0.834
9
0.666
0.798
10
0.632
0.765
11
0.602
0.735
12
0.576
0.708
13
0.553
0.684
14
0.532
0.661
15
0.514
0.641
16
0.497
0.623
17
0.482
0.606
18
0.468
0.590
19
0.456
0.575
20
0.444
0.561
25...
n
α=0.05
α=0.01
NOTE: To test
H0:
ρ=0
against
H1:
ρ≠0,
reject
H0
if the absolute value of r is greater than the critical value in
the table.
4
0.950
0.990
5
0.878
0.959
6
0.811
0.917
7
0.754
0.875
8
0.707
0.834
9
0.666
0.798
10
0.632
0.765
11
0.602
0.735
12
0.576
0.708
13
0.553
0.684
14
0.532
0.661
15
0.514
0.641
16
0.497
0.623
17
0.482
0.606
18
0.468
0.590
19
0.456
0.575
20
0.444
0.561
25...
 please answer all parts
1 Critical Values of the Pearson Correlation Coefficient Critical Values of the Pearson Correlation coefficient a = 0.05 a = 0.01 0.950 10.990 0.878 0.959 0.811 0.917 0.754 0.875 0.707 0.834 0.666 10.798 0.632 0.765 0.602 0.735 0.576 0.708 0.553 0.684 0.532 0.661 0.514 0.641 0.497 0.623 0.482 0.606 0.468 10.590 0.456 0.575 0.444 0.561 0.396 0.505 10.361 10.463 sand Print Done 17 18 19 0.402 0.468 0.590 0.456 10.575 0.444 0.561 0.396 0.505 0.361 0.463...
please answer all parts
1 Critical Values of the Pearson Correlation Coefficient Critical Values of the Pearson Correlation coefficient a = 0.05 a = 0.01 0.950 10.990 0.878 0.959 0.811 0.917 0.754 0.875 0.707 0.834 0.666 10.798 0.632 0.765 0.602 0.735 0.576 0.708 0.553 0.684 0.532 0.661 0.514 0.641 0.497 0.623 0.482 0.606 0.468 10.590 0.456 0.575 0.444 0.561 0.396 0.505 10.361 10.463 sand Print Done 17 18 19 0.402 0.468 0.590 0.456 10.575 0.444 0.561 0.396 0.505 0.361 0.463...
 Find the regression equation letting overhead with be the predictor(s) variable. Find the best predicted weight of a seal the overhead width moured from a photograph is 16 cm. Can the prediction be correct? What is wrong with predicting the weight in this case? Use a significance level of 0.05. Overhead Width (cm) 84 79 82 7.8 Weight (kg) 201 209 190 181 200 Click the loon to view the critical values of the Pearson correlation coeficient The regression equation...
Most questions answered within 3 hours.
-
Where is the error in this code sequence?
String s1 = "Hello";
String s2 = "ello";...
asked 10 months ago -
Financial data for Joel de Paris, Inc., for last year
follow:
Joel de Paris, Inc.
Balance...
asked 10 months ago -
Consider this reaction:
Al2(SO4)3 (aq)+ BaCl3
(aq) Al2Cl6 (aq)- +
3BaSO4(s) . What is the...
asked 10 months ago -
Suppose that Savneet is considering increasing her
recent random sample from 20 car rentals to 40...
asked 10 months ago -
Trucks arrive at an unloading terminal at an average rate of 120
per hour.
Trucks arrive...
asked 10 months ago -
Why are methanol and ethanol completely soluble in water while
octanol is not very little soluble....
asked 10 months ago -
A facilities manager at a university reads in a research report
that the mean amount of...
asked 10 months ago -
When the CuSO4 is rehydrated by adding water to the anhydrous
compound, is this an endothermic...
asked 10 months ago -
A ray of sunlight is passing from diamond into crown glass; the
angle of incidence is...
asked 10 months ago -
A block of mass 0.249 kg is placed on top of a light, vertical
spring of...
asked 10 months ago -
how do the kidneys compensate in the presences of acidosis
a) trigger hyperventilate
b) reserve acid...
asked 10 months ago -
Question 501 pts
The rental rate of capital to the firm increases. Which of the
following...
asked 10 months ago