Create a hypothesis test question and show all the steps to solve it. Example: You found...
Create a hypothesis test question and show all the steps to solve it. Example: You found the mean for each quantitative variable. So, one at a time, is there significant evidence that the population maintenance cost for buses is more than###? and Find the regression equation for the 2 variables and explain what it is you found. Create a hypothesis test question for price and Size.
| record | Agent | Price | Size | Bedrooms | Baths | Pool (yes is 1) | Garage (Yes is 1) | Days | Township | Mortgage type | Years | FICO | Default (Yes is 1) |
| 1 | Marty | 206424 | 1820 | 2 | 1.5 | 1 | 1 | 33 | 2 | Fixed | 2 | 824 | 0 |
| 2 | Rose | 346150 | 3010 | 3 | 2 | 0 | 0 | 36 | 4 | Fixed | 9 | 820 | 0 |
| 3 | Carter | 372360 | 3210 | 4 | 3 | 0 | 1 | 21 | 2 | Fixed | 18 | 819 | 0 |
| 4 | Peterson | 310622 | 3330 | 3 | 2.5 | 1 | 0 | 26 | 3 | Fixed | 17 | 817 | 0 |
| 5 | Carter | 496100 | 4510 | 6 | 4.5 | 0 | 1 | 13 | 4 | Fixed | 17 | 816 | 0 |
| 6 | Peterson | 294086 | 3440 | 4 | 3 | 1 | 1 | 31 | 4 | Fixed | 19 | 813 | 0 |
| 7 | Carter | 228810 | 2630 | 4 | 2.5 | 0 | 1 | 39 | 4 | Adjustable | 10 | 813 | 0 |
| 8 | Isaacs | 384420 | 4470 | 5 | 3.5 | 0 | 1 | 26 | 2 | Fixed | 6 | 812 | 0 |
| 9 | Peterson | 416120 | 4040 | 5 | 3.5 | 0 | 1 | 26 | 4 | Fixed | 3 | 810 | 0 |
| 10 | Isaacs | 487494 | 4380 | 6 | 4 | 1 | 1 | 32 | 3 | Fixed | 6 | 808 | 0 |
| 11 | Rose | 448800 | 5280 | 6 | 4 | 0 | 1 | 35 | 4 | Fixed | 8 | 806 | 1 |
| 12 | Peterson | 388960 | 4420 | 4 | 3 | 0 | 1 | 50 | 2 | Adjustable | 9 | 805 | 1 |
| 13 | Marty | 335610 | 2970 | 3 | 2.5 | 0 | 1 | 25 | 3 | Adjustable | 9 | 801 | 1 |
| 14 | Rose | 276000 | 2300 | 2 | 1.5 | 0 | 0 | 34 | 1 | Fixed | 20 | 798 | 0 |
| 15 | Rose | 346421 | 2970 | 4 | 3 | 1 | 1 | 17 | 3 | Adjustable | 10 | 795 | 0 |
| 16 | Isaacs | 453913 | 3660 | 6 | 4 | 1 | 1 | 12 | 3 | Fixed | 18 | 792 | 0 |
| 17 | Carter | 376146 | 3290 | 5 | 3.5 | 1 | 1 | 28 | 2 | Adjustable | 9 | 792 | 1 |
| 18 | Peterson | 694430 | 5900 | 5 | 3.5 | 1 | 1 | 36 | 3 | Adjustable | 10 | 788 | 0 |
| 19 | Rose | 251269 | 2050 | 3 | 2 | 1 | 1 | 38 | 3 | Fixed | 16 | 786 | 0 |
| 20 | Rose | 547596 | 4920 | 6 | 4.5 | 1 | 1 | 37 | 5 | Fixed | 2 | 785 | 0 |
| 21 | Marty | 214910 | 1950 | 2 | 1.5 | 1 | 0 | 20 | 4 | Fixed | 6 | 784 | 0 |
| 22 | Rose | 188799 | 1950 | 2 | 1.5 | 1 | 0 | 52 | 1 | Fixed | 10 | 782 | 0 |
| 23 | Carter | 459950 | 4680 | 4 | 3 | 1 | 1 | 31 | 4 | Fixed | 8 | 781 | 0 |
| 24 | Isaacs | 264160 | 2540 | 3 | 2.5 | 0 | 1 | 40 | 1 | Fixed | 18 | 780 | 0 |
| 25 | Carter | 393557 | 3180 | 4 | 3 | 1 | 1 | 54 | 1 | Fixed | 20 | 776 | 0 |
| 26 | Isaacs | 478675 | 4660 | 5 | 3.5 | 1 | 1 | 26 | 5 | Adjustable | 9 | 773 | 0 |
| 27 | Carter | 384020 | 4220 | 5 | 3.5 | 0 | 1 | 23 | 4 | Adjustable | 9 | 772 | 1 |
| 28 | Marty | 313200 | 3600 | 4 | 3 | 0 | 1 | 31 | 3 | Fixed | 19 | 772 | 0 |
| 29 | Isaacs | 274482 | 2990 | 3 | 2 | 1 | 0 | 37 | 3 | Fixed | 5 | 769 | 0 |
| 30 | Marty | 167962 | 1920 | 2 | 1.5 | 1 | 1 | 31 | 5 | Fixed | 6 | 769 | 0 |
Homework Answers
We will use R in this case to solve the hypothesis and regression problem.
Now, the mean of the price is 360048.2, we can find it using the following code:
> data = read.table(file = 'clipboard',sep = '\t',header=TRUE)
> mean(data$Price)
[1] 360048.2
Now, we will propose the following null and alternative hypothesis:

Note that the test is a right tailed test. We will use the following statistic:

Now, the standard deviation of the price is 1178732.5. Hence the observed statistic value becomes:
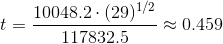
Now,the p-value in this case would be:

Hence, at 95% confidence level, we can say that we fail to reject the null hypothesis.
The following code is used for calculation:
> mean(data$Price)
[1] 360048.2
> sd(data$Price)
[1] 117832.5
> pt(0.459,29,lower.tail=FALSE)
[1] 0.324828
Now, we will analyze the regression between price and space. The analysis in R is given below:
> model = lm(Price~Size,data=data)
> summary(model)

Call:
lm(formula = Price ~ Size, data = data)

Residuals:
   Min     1Q Median     3Q    Max
-88801 -38584   3610  34405  95796

Coefficients:
             Estimate Std. Error t value Pr(>|t|)
(Intercept) 17838.578  29916.627   0.596    0.556
Size           98.440      8.221  11.975 1.57e-12 ***
---
Signif. codes:  0 ‘***’ 0.001 ‘**’ 0.01 ‘*’ 0.05 ‘.’ 0.1 ‘ ’ 1

Residual standard error: 48470 on 28 degrees of freedom
Multiple R-squared:  0.8366,    Adjusted R-squared:  0.8308
F-statistic: 143.4 on 1 and 28 DF,  p-value: 1.566e-12
From the summary of the result, we can see that the linear regression equation between price and size is

and the t test for coefficient of Size returns a value lesser than 0.05. Hence, we can say that the slope is non zero. Also the R squared statistic implies that the regression model explains 83.66% of the variation in Price, thus making the model good enough
Add Answer to:
Create a hypothesis test question and show all the steps to
solve it. Example: You found...
Create a confidence interval for a population mean and interpret it. Use either 90 95 or...
Create a confidence interval for a population mean and interpret it. Use either 90 95 or 99 percent confidence interval. Do this for each quantitative question. Remember to interpret the confidence intervals. CREATE CONFIDENCE INTERVAL FOR PRICE AND SIZE record Agent Price Size Bedrooms Baths Pool (yes is 1) Garage (Yes is 1) Days Township Mortgage type Years FICO Default (Yes is 1) 1 Marty 206424 1820 2 1.5 1 1 33 2 Fixed 2 824 0 2 Rose 346150...
Conduct a hypothesis test (showing ALL 4 steps involved) to answer the question, "Does the amount...
 Conduct a hypothesis test (showing ALL 4 steps involved) to
answer the question, "Does the amount o sleep affect how well
someone does on a quiz?", using the following data:
4 hours
6 hours
8 hours
10 hours
1
1
1
7
4
1
2
6
9
4
2
5
5
3
1
8
T
19
9
6
26
n
4
4
4
4
M
4.75
2.25
1.5
6.5
SS
32.75
6.75
1
5
Conduct a hypothesis test (showing ALL 4 steps involved) to
answer the question, "Does the amount o sleep affect how well
someone does on a quiz?", using the following data:
4 hours
6 hours
8 hours
10 hours
1
1
1
7
4
1
2
6
9
4
2
5
5
3
1
8
T
19
9
6
26
n
4
4
4
4
M
4.75
2.25
1.5
6.5
SS
32.75
6.75
1
5
Chapter 8 - Fl_student_survey - Do the hypothesis test to check if the population proportion of Republicans is less than.50? Also, calculate and interpret the 95% confidence intervals for the populat...
 Chapter 8 - Fl_student_survey - Do the hypothesis test
to check if the population proportion of Republicans is
less than.50? Also, calculate and interpret the 95% confidence
intervals for the population proportion.
Please show all the details/relevant graphs and
explanations.
Data:
060300210110,,2 0 0 1 1 2 2 1 000 33 000 053637433 2172 111302047 2272 7,5 4 5 6 5 2 3 sl 15 3 1 1 3679 12 0 4 2 7 473 236 5 7 10 14...
Chapter 8 - Fl_student_survey - Do the hypothesis test
to check if the population proportion of Republicans is
less than.50? Also, calculate and interpret the 95% confidence
intervals for the population proportion.
Please show all the details/relevant graphs and
explanations.
Data:
060300210110,,2 0 0 1 1 2 2 1 000 33 000 053637433 2172 111302047 2272 7,5 4 5 6 5 2 3 sl 15 3 1 1 3679 12 0 4 2 7 473 236 5 7 10 14...
You believe that ‘Purchase intention’ about a product of the consumer will be dependent on the...
You believe that ‘Purchase intention’ about a product of the consumer will be dependent on the ‘skepticism’ of the consumer towards the brand. Run the appropriate analysis for the problem using the following dataset and answer the following 1A - 1D: DATA SET ID Purchase Intention Skepticism 1 6 1 2 5.5 1 3 5 1 4 7 1 5 1 5 6 2 5 7 2 5 8 3 5 9 1 5 10 1 5 11 3.5 5 12...
Help me fix my code's error: SQL Programming Error Message 8101 CREATE TABLE tblGPA ...
Help me fix my code's error: SQL Programming Error Message 8101 CREATE TABLE tblGPA (GPA_ID INT IDENTITY(10001,1) , MemberID INT REFERENCES tblMembers, Q1GPA DECIMAL, Q2GPA DECIMAL, Q3GPA DECIMAL, Q4GPA DECIMAL, ); -- Insert data into the TRANSACTIONS table INSERT INTO tblGPA VALUES (10001, 1, 4.0, 4.0, 3.5, 4.0), (10002, 2, 4.0, 3.5, 4.0, 3.5), (10003, 3, 3.5, 3.5, 3.5, 3.5),...
Variable Variable Define sex gender tv Hours of TV watched per week computer Hours spent on...
Variable Variable Define sex gender tv Hours of TV watched per week computer Hours spent on computer per week sleep Average number of hours sleep per night alcohol Average number of alcoholic drinks per week exercise Average number of hours exercise per week gpa Grade point average max 5 faculty faculty of study health Health Status rating No. Respondents sex tv computer sleep alcohol exercise gpa faculty health 1 1 13 10 5 12 2 2 1 2 2 1...
6. (6 points) Let f(x) = 3x and let g(x) be the function shown in Figure...
 6. (6 points) Let f(x) = 3x and let g(x) be the function shown in Figure 1. Determine So f()g'(x)dx. Figure 1: Graph of g() 1.5 + 1 9(0) -0. 5 0 0.5 1 1.5 2 2.5 3 3.5 4 4.5 5 5.5 6 6.5 -0.5 +
Please help with test statistic and p value A realty company would like to develop a...
 Please help with test statistic and p value
A realty company would like to develop a regression model to help it set weekly rental rates for beach properties (y). The independent variables for this model are Use the accompanying data to complete () its age (X2)- the number of bedrooms a property has and the number of blocks away from the ocean it is (3) parts a through e below BE Click the icon to view the rental property data....
Please help with test statistic and p value
A realty company would like to develop a regression model to help it set weekly rental rates for beach properties (y). The independent variables for this model are Use the accompanying data to complete () its age (X2)- the number of bedrooms a property has and the number of blocks away from the ocean it is (3) parts a through e below BE Click the icon to view the rental property data....
NO HAND WRITTEN RESPONSES SHOW ALL WORK AND ALL STEPS Determine the molar mass of the...
 NO HAND WRITTEN RESPONSES SHOW ALL WORK AND ALL STEPS
Determine the molar mass of the unknown sloute show work
for each trial
Data Solution Pure Solvent Trial #2 Time (minutes: Temp Observations Time (minutes: Temp Observations Temp Observations seconds) ( C) 0 80 200 0:15 2 0:301O 0:30 a 0:60 0:60 1:30 us alizat 1:45 2:00 2:15 1:30S 1:45oy 2:00 2:15 e 3.5 2:45 3:00 2:45 3:00 3:15 3:30 3:45 4:00 4:15 3:30 3:45 4:00 4:15 4:30 4:45 5:00...
NO HAND WRITTEN RESPONSES SHOW ALL WORK AND ALL STEPS
Determine the molar mass of the unknown sloute show work
for each trial
Data Solution Pure Solvent Trial #2 Time (minutes: Temp Observations Time (minutes: Temp Observations Temp Observations seconds) ( C) 0 80 200 0:15 2 0:301O 0:30 a 0:60 0:60 1:30 us alizat 1:45 2:00 2:15 1:30S 1:45oy 2:00 2:15 e 3.5 2:45 3:00 2:45 3:00 3:15 3:30 3:45 4:00 4:15 3:30 3:45 4:00 4:15 4:30 4:45 5:00...
please solve the equation to #17. Please show work with the steps written out. thank you!...
 please solve the equation to #17. Please show work with the
steps written out. thank you!
0.4.3 Exercises In Exercises 1 - 18, solve the equation. 1. lx= 6 2. 13t – 11 = 10 4. 4 – ly = 3 5. 215m +11 - 3 = 0 7.5 -1x1=1 8. 215 – 271 - = 5 2 11. 12x + 1 = 12x + 1 - 3 10. 2 3 -12v+ 13. 31 - 2| = |2t +7] 16....
please solve the equation to #17. Please show work with the
steps written out. thank you!
0.4.3 Exercises In Exercises 1 - 18, solve the equation. 1. lx= 6 2. 13t – 11 = 10 4. 4 – ly = 3 5. 215m +11 - 3 = 0 7.5 -1x1=1 8. 215 – 271 - = 5 2 11. 12x + 1 = 12x + 1 - 3 10. 2 3 -12v+ 13. 31 - 2| = |2t +7] 16....
 Conduct a hypothesis test (showing ALL 4 steps involved) to
answer the question, "Does the amount o sleep affect how well
someone does on a quiz?", using the following data:
4 hours
6 hours
8 hours
10 hours
1
1
1
7
4
1
2
6
9
4
2
5
5
3
1
8
T
19
9
6
26
n
4
4
4
4
M
4.75
2.25
1.5
6.5
SS
32.75
6.75
1
5
Conduct a hypothesis test (showing ALL 4 steps involved) to
answer the question, "Does the amount o sleep affect how well
someone does on a quiz?", using the following data:
4 hours
6 hours
8 hours
10 hours
1
1
1
7
4
1
2
6
9
4
2
5
5
3
1
8
T
19
9
6
26
n
4
4
4
4
M
4.75
2.25
1.5
6.5
SS
32.75
6.75
1
5
 Chapter 8 - Fl_student_survey - Do the hypothesis test
to check if the population proportion of Republicans is
less than.50? Also, calculate and interpret the 95% confidence
intervals for the population proportion.
Please show all the details/relevant graphs and
explanations.
Data:
060300210110,,2 0 0 1 1 2 2 1 000 33 000 053637433 2172 111302047 2272 7,5 4 5 6 5 2 3 sl 15 3 1 1 3679 12 0 4 2 7 473 236 5 7 10 14...
Chapter 8 - Fl_student_survey - Do the hypothesis test
to check if the population proportion of Republicans is
less than.50? Also, calculate and interpret the 95% confidence
intervals for the population proportion.
Please show all the details/relevant graphs and
explanations.
Data:
060300210110,,2 0 0 1 1 2 2 1 000 33 000 053637433 2172 111302047 2272 7,5 4 5 6 5 2 3 sl 15 3 1 1 3679 12 0 4 2 7 473 236 5 7 10 14...
 6. (6 points) Let f(x) = 3x and let g(x) be the function shown in Figure 1. Determine So f()g'(x)dx. Figure 1: Graph of g() 1.5 + 1 9(0) -0. 5 0 0.5 1 1.5 2 2.5 3 3.5 4 4.5 5 5.5 6 6.5 -0.5 +
 Please help with test statistic and p value
A realty company would like to develop a regression model to help it set weekly rental rates for beach properties (y). The independent variables for this model are Use the accompanying data to complete () its age (X2)- the number of bedrooms a property has and the number of blocks away from the ocean it is (3) parts a through e below BE Click the icon to view the rental property data....
Please help with test statistic and p value
A realty company would like to develop a regression model to help it set weekly rental rates for beach properties (y). The independent variables for this model are Use the accompanying data to complete () its age (X2)- the number of bedrooms a property has and the number of blocks away from the ocean it is (3) parts a through e below BE Click the icon to view the rental property data....
 NO HAND WRITTEN RESPONSES SHOW ALL WORK AND ALL STEPS
Determine the molar mass of the unknown sloute show work
for each trial
Data Solution Pure Solvent Trial #2 Time (minutes: Temp Observations Time (minutes: Temp Observations Temp Observations seconds) ( C) 0 80 200 0:15 2 0:301O 0:30 a 0:60 0:60 1:30 us alizat 1:45 2:00 2:15 1:30S 1:45oy 2:00 2:15 e 3.5 2:45 3:00 2:45 3:00 3:15 3:30 3:45 4:00 4:15 3:30 3:45 4:00 4:15 4:30 4:45 5:00...
NO HAND WRITTEN RESPONSES SHOW ALL WORK AND ALL STEPS
Determine the molar mass of the unknown sloute show work
for each trial
Data Solution Pure Solvent Trial #2 Time (minutes: Temp Observations Time (minutes: Temp Observations Temp Observations seconds) ( C) 0 80 200 0:15 2 0:301O 0:30 a 0:60 0:60 1:30 us alizat 1:45 2:00 2:15 1:30S 1:45oy 2:00 2:15 e 3.5 2:45 3:00 2:45 3:00 3:15 3:30 3:45 4:00 4:15 3:30 3:45 4:00 4:15 4:30 4:45 5:00...
 please solve the equation to #17. Please show work with the
steps written out. thank you!
0.4.3 Exercises In Exercises 1 - 18, solve the equation. 1. lx= 6 2. 13t – 11 = 10 4. 4 – ly = 3 5. 215m +11 - 3 = 0 7.5 -1x1=1 8. 215 – 271 - = 5 2 11. 12x + 1 = 12x + 1 - 3 10. 2 3 -12v+ 13. 31 - 2| = |2t +7] 16....
please solve the equation to #17. Please show work with the
steps written out. thank you!
0.4.3 Exercises In Exercises 1 - 18, solve the equation. 1. lx= 6 2. 13t – 11 = 10 4. 4 – ly = 3 5. 215m +11 - 3 = 0 7.5 -1x1=1 8. 215 – 271 - = 5 2 11. 12x + 1 = 12x + 1 - 3 10. 2 3 -12v+ 13. 31 - 2| = |2t +7] 16....
Most questions answered within 3 hours.
-
Where is the error in this code sequence?
String s1 = "Hello";
String s2 = "ello";...
asked 10 months ago -
Financial data for Joel de Paris, Inc., for last year
follow:
Joel de Paris, Inc.
Balance...
asked 10 months ago -
Consider this reaction:
Al2(SO4)3 (aq)+ BaCl3
(aq) Al2Cl6 (aq)- +
3BaSO4(s) . What is the...
asked 10 months ago -
Suppose that Savneet is considering increasing her
recent random sample from 20 car rentals to 40...
asked 10 months ago -
Trucks arrive at an unloading terminal at an average rate of 120
per hour.
Trucks arrive...
asked 10 months ago -
Why are methanol and ethanol completely soluble in water while
octanol is not very little soluble....
asked 10 months ago -
A facilities manager at a university reads in a research report
that the mean amount of...
asked 10 months ago -
When the CuSO4 is rehydrated by adding water to the anhydrous
compound, is this an endothermic...
asked 10 months ago -
A ray of sunlight is passing from diamond into crown glass; the
angle of incidence is...
asked 10 months ago -
A block of mass 0.249 kg is placed on top of a light, vertical
spring of...
asked 10 months ago -
how do the kidneys compensate in the presences of acidosis
a) trigger hyperventilate
b) reserve acid...
asked 10 months ago -
Question 501 pts
The rental rate of capital to the firm increases. Which of the
following...
asked 10 months ago