
Homework Answers

Add Answer to:
The table below lists the number of games played in a yearly best-of-seven baseball championship series,...
The table below lists the number of games played in a yearly best-of-seven baseball championship series,...
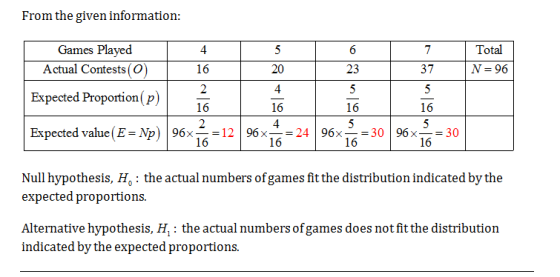
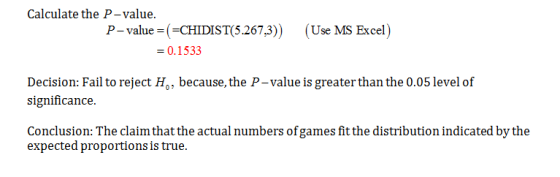
The table below lists the number of games played in a yearly best-of-seven baseball championship series, along with the expected proportions for the number of games played with teams of equal abilities. Use a 0.05 significance level to test the claim that the actual numbers of games fit the distribution indicated by the expected proportions. Games Played 4 5 6 7 Actual contests 16 21 22 37 Expected proportion find the x to the power 2 and p value
11.1.15-T Assigned Media Question Help The table below lists the number of games played in a...
 11.1.15-T Assigned Media Question Help The table below lists the number of games played in a yearly best-of-seven baseball championship series, along with the expected proportions for the number of games played with tears of equal abilities. Use a 0.05 significance level to test the daim that the actual numbers of games fit the distribution indicated by the expected proportions Games Played 4 5 6 7 Actual contests 18 19 24 39 Calculate the test statistic, x? x-(Round to three...
The table lists the number of games played (from 4 to 7) in the Major League...
 The table lists the number of games played (from 4 to 7) in the
Major League Baseball championship, the World Series, over the last
100 years. It also includes the expected proportions for the number
of games played with teams of equal abilities.
Use a 0.05 significance level to test the claim that the actual
numbers of games fit the distribution indicated by the expected
proportions.
a)To find the test statistic, begin by converting the expected
proportions in each category...
The table lists the number of games played (from 4 to 7) in the
Major League Baseball championship, the World Series, over the last
100 years. It also includes the expected proportions for the number
of games played with teams of equal abilities.
Use a 0.05 significance level to test the claim that the actual
numbers of games fit the distribution indicated by the expected
proportions.
a)To find the test statistic, begin by converting the expected
proportions in each category...
pls answer p value and critical value, thanks. The table below lists the number of games...
 pls answer p value and critical value, thanks.
The table below lists the number of games played in a yearly best-of-seven baseball championship series, along with the expected proportions for the number of games played with teams of equal abilities. Use a 0.05 significance level to test the claim that the actual numbers of games fit the distribution indicated by the expected proportion:s Games Played 4 6 7
pls answer p value and critical value, thanks.
The table below lists the number of games played in a yearly best-of-seven baseball championship series, along with the expected proportions for the number of games played with teams of equal abilities. Use a 0.05 significance level to test the claim that the actual numbers of games fit the distribution indicated by the expected proportion:s Games Played 4 6 7
The following data represent the number of games played in each series of an annual tournament...
 The following data represent the number of games played in each series of an annual tournament from 1925 to 2001. Complete parts (a) through (d) below x (games played)456 7 15 11 22 28 Frequency (a) Construct a discrete probability distribution for the random variable x. x (games played)P) 4 (Round to four decimal places as needed.) (b) Graph the discrete probability distribution. Choose the correct graph below A. P(x) P(x) P(x) 0.5 P(x) 0.5 0.5 0.5 (c) Compute and...
4). a.b. The following data represent the number of games played in each series of an...
 4).
a.b.
The following data represent the number of games played in each series of an annual tournament from 1925 to 2003. Complete parts (a) through (d) below. 4 x (games played) Frequency 5 17 6 22 70 24 15 (a) Construct a discrete probability distribution for the random variable x. x (games played) P(x) 4 5 6 7 (Round to four decimal places as needed.) (b) Graph the discrete probability distribution. Choose the correct graph below. O A. OB....
4).
a.b.
The following data represent the number of games played in each series of an annual tournament from 1925 to 2003. Complete parts (a) through (d) below. 4 x (games played) Frequency 5 17 6 22 70 24 15 (a) Construct a discrete probability distribution for the random variable x. x (games played) P(x) 4 5 6 7 (Round to four decimal places as needed.) (b) Graph the discrete probability distribution. Choose the correct graph below. O A. OB....
4). a. The following data represent the number of games played in each series of an...
 4).
a.
The following data represent the number of games played in each series of an annual tournament from 1925 to 2003. Complete parts (a) through (d) below. D x (games played) 4 Frequency 15 5 17 6 22 7 24 4 1 5 1 6 1 7 1 (Round to four decimal places as needed.) (b) Graph the discrete probability distribution. Choose the correct graph below. O A OB. AP(x) 0.5- AP(X) 0.5- OC. AP(x) 0.54 OD AP(x) 0.5-...
4).
a.
The following data represent the number of games played in each series of an annual tournament from 1925 to 2003. Complete parts (a) through (d) below. D x (games played) 4 Frequency 15 5 17 6 22 7 24 4 1 5 1 6 1 7 1 (Round to four decimal places as needed.) (b) Graph the discrete probability distribution. Choose the correct graph below. O A OB. AP(x) 0.5- AP(X) 0.5- OC. AP(x) 0.54 OD AP(x) 0.5-...
The following data represent the number of games played in each series of an annual tournament...
The following data represent the number of games played in each series of an annual tournament from1933 to 2007. Complete parts (a) through (d) below. a)Construct a discrete probability distribution for the random variable x. (c) Compute and interpret the mean of the random variable x. mu equals= games (Round to four decimal places as needed.) Interpret the mean of the random variable x. A. The series, if played one time, would be expected to last about 5.6 games. B....
6.1.21 Question Help The following data represent the number of games played in each series of...
6.1.21 Question Help The following data represent the number of games played in each series of an annual tournament from 1925 to 2003. Complete parts (a) through (d) below. x (games played) 4 5 6 7 Frequency 1616 1515 1919 2828 (a) Construct a discrete probability distribution for the random variable x. x (games played) P(x) 4 nothing 5 nothing 6 nothing 7 nothing (Round to four decimal places as needed.) Enter your answer in the edit fields and then...
The table below represents the number of games played in a World Series from 1905 to 2013...
The table below represents the number of games played in a World Series from 1905 to 2013 ( excluding 1994 when there was no word series because of the baseball strike) and the probability of each length. Number of Games Probability 4 0.21 5 0.22 6 0.23 7 0.34 What is the probability that a world series is less than 6 games? .23 .34 .66 .43
 11.1.15-T Assigned Media Question Help The table below lists the number of games played in a yearly best-of-seven baseball championship series, along with the expected proportions for the number of games played with tears of equal abilities. Use a 0.05 significance level to test the daim that the actual numbers of games fit the distribution indicated by the expected proportions Games Played 4 5 6 7 Actual contests 18 19 24 39 Calculate the test statistic, x? x-(Round to three...
 The table lists the number of games played (from 4 to 7) in the
Major League Baseball championship, the World Series, over the last
100 years. It also includes the expected proportions for the number
of games played with teams of equal abilities.
Use a 0.05 significance level to test the claim that the actual
numbers of games fit the distribution indicated by the expected
proportions.
a)To find the test statistic, begin by converting the expected
proportions in each category...
The table lists the number of games played (from 4 to 7) in the
Major League Baseball championship, the World Series, over the last
100 years. It also includes the expected proportions for the number
of games played with teams of equal abilities.
Use a 0.05 significance level to test the claim that the actual
numbers of games fit the distribution indicated by the expected
proportions.
a)To find the test statistic, begin by converting the expected
proportions in each category...
 pls answer p value and critical value, thanks.
The table below lists the number of games played in a yearly best-of-seven baseball championship series, along with the expected proportions for the number of games played with teams of equal abilities. Use a 0.05 significance level to test the claim that the actual numbers of games fit the distribution indicated by the expected proportion:s Games Played 4 6 7
pls answer p value and critical value, thanks.
The table below lists the number of games played in a yearly best-of-seven baseball championship series, along with the expected proportions for the number of games played with teams of equal abilities. Use a 0.05 significance level to test the claim that the actual numbers of games fit the distribution indicated by the expected proportion:s Games Played 4 6 7
 The following data represent the number of games played in each series of an annual tournament from 1925 to 2001. Complete parts (a) through (d) below x (games played)456 7 15 11 22 28 Frequency (a) Construct a discrete probability distribution for the random variable x. x (games played)P) 4 (Round to four decimal places as needed.) (b) Graph the discrete probability distribution. Choose the correct graph below A. P(x) P(x) P(x) 0.5 P(x) 0.5 0.5 0.5 (c) Compute and...
 4).
a.b.
The following data represent the number of games played in each series of an annual tournament from 1925 to 2003. Complete parts (a) through (d) below. 4 x (games played) Frequency 5 17 6 22 70 24 15 (a) Construct a discrete probability distribution for the random variable x. x (games played) P(x) 4 5 6 7 (Round to four decimal places as needed.) (b) Graph the discrete probability distribution. Choose the correct graph below. O A. OB....
4).
a.b.
The following data represent the number of games played in each series of an annual tournament from 1925 to 2003. Complete parts (a) through (d) below. 4 x (games played) Frequency 5 17 6 22 70 24 15 (a) Construct a discrete probability distribution for the random variable x. x (games played) P(x) 4 5 6 7 (Round to four decimal places as needed.) (b) Graph the discrete probability distribution. Choose the correct graph below. O A. OB....
 4).
a.
The following data represent the number of games played in each series of an annual tournament from 1925 to 2003. Complete parts (a) through (d) below. D x (games played) 4 Frequency 15 5 17 6 22 7 24 4 1 5 1 6 1 7 1 (Round to four decimal places as needed.) (b) Graph the discrete probability distribution. Choose the correct graph below. O A OB. AP(x) 0.5- AP(X) 0.5- OC. AP(x) 0.54 OD AP(x) 0.5-...
4).
a.
The following data represent the number of games played in each series of an annual tournament from 1925 to 2003. Complete parts (a) through (d) below. D x (games played) 4 Frequency 15 5 17 6 22 7 24 4 1 5 1 6 1 7 1 (Round to four decimal places as needed.) (b) Graph the discrete probability distribution. Choose the correct graph below. O A OB. AP(x) 0.5- AP(X) 0.5- OC. AP(x) 0.54 OD AP(x) 0.5-...
Most questions answered within 3 hours.
-
Where is the error in this code sequence?
String s1 = "Hello";
String s2 = "ello";...
asked 11 months ago -
Financial data for Joel de Paris, Inc., for last year
follow:
Joel de Paris, Inc.
Balance...
asked 11 months ago -
Consider this reaction:
Al2(SO4)3 (aq)+ BaCl3
(aq) Al2Cl6 (aq)- +
3BaSO4(s) . What is the...
asked 11 months ago -
Suppose that Savneet is considering increasing her
recent random sample from 20 car rentals to 40...
asked 11 months ago -
Trucks arrive at an unloading terminal at an average rate of 120
per hour.
Trucks arrive...
asked 11 months ago -
Why are methanol and ethanol completely soluble in water while
octanol is not very little soluble....
asked 11 months ago -
A facilities manager at a university reads in a research report
that the mean amount of...
asked 11 months ago -
When the CuSO4 is rehydrated by adding water to the anhydrous
compound, is this an endothermic...
asked 11 months ago -
A ray of sunlight is passing from diamond into crown glass; the
angle of incidence is...
asked 11 months ago -
A block of mass 0.249 kg is placed on top of a light, vertical
spring of...
asked 11 months ago -
how do the kidneys compensate in the presences of acidosis
a) trigger hyperventilate
b) reserve acid...
asked 11 months ago -
Question 501 pts
The rental rate of capital to the firm increases. Which of the
following...
asked 11 months ago