
Homework Answers
Using minitab,
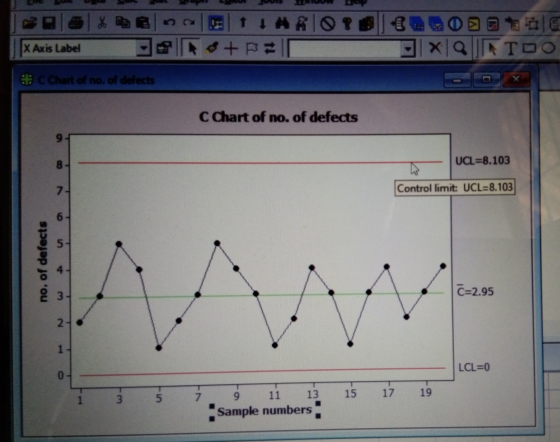
Conclusion:- The process is under control.
1st test as Random
Add Answer to:
Rolls of coiled wire are monitored using a c-chart. Twenty rolls have been examined, and the...
A paper mill uses a control chart to Data on Imperfections in Rolls of Paper monitor...
 A paper mill uses a control chart to Data on Imperfections in Rolls of Paper monitor the imperfection in finished Total Total Ils of paper. Production output is umber Number of Number Number of of Rolls Imper- Day Produced fections Day Produced fections inspected for twenty days, and the resulting data are shown here. Use these data to set up a control chart for 218 4 12 18 14 nonconformities per roll of paper. Does the process appear to be...
8 have been gathered with the following results A services process is monitored using x-bar and...
 8 have been gathered with the following results A services process is monitored using x-bar and R charts. Eight samples of n5 observations Sample 2 4 Mean 7.2 7.4 6.6 6.8 7.9 6.0 7.2 6.2 Range .43 .52 .53 20 .36 .42 .35 .42 7 8 Using this data, compute the centerline, the 3 sd upper control limit, and the lower control limits for the x-bar and R charts X-bar R-bar UCL r-bar LCL r-bar UCL x-bar LCL x-bar a....
Checkout time at a supermarket is monitored using a mean and a range chart. Six samples...
Checkout time at a supermarket is monitored using a mean and a range chart. Six samples of n = 20 observations have been obtained and the sample means and ranges computed: Sample Mean Range Sample Mean Range 1 3.06 .42 4 3.13 .46 2 3.15 .49 5 3.06 .46 3 3.11 .41 6 3.09 .45 Factors for three-sigma control limits for x¯x¯ and R charts FACTORS FOR R CHARTS Number of Observations in Subgroup, n Factor for x¯x¯ Chart, A2 Lower...
Quasar Exports Ltd, a fictional Turkish manufacturer of glass, wants to use a c-chart to monitor...
Quasar Exports Ltd, a fictional Turkish manufacturer of glass, wants to use a c-chart to monitor the number of defects in the sheets of glass it produces. The company wants to use the chart to address the production problems it is experiencing and use it on an ongoing basis as a monitoring tool. To construct the chart, the company collected data over 5 days by inspecting 30 sheets of glass and recording the number defects per sheet. The data are...
The time to replace vehicle wiper blades at a service center was monitored using a mean and a range chart.
 Question 3 The time to replace vehicle wiper blades at a service center was monitored using a mean and a range chart. Six samples of n = 20 observations were obtained, and the sample means and ranges computed: Sample Mean Range Sample Mean Range 3.06 .42 4 3.13 46 3.15 .50 3.06 46 3.11 41 3.09 45 Using the factors in the provided table, determine upper and lower limits for mean and range charts. Is the process in control?
Loan Processing times are being monitored at a local company. Samples of six observations each have...
Loan Processing times are being monitored at a local company. Samples of six observations each have been taken, and the results are listed. Using Factors from Table 10.3, determine lower and upper control limits for a a mean chart Sample Number 1 2 3 4 5 60 57 54 69 49 73 64 67 61 62 64 61 69 59 71 67 63 62 65 60 59 68 57 52 69 53 58 60 60 61
Defects of 400 products coming from a factory production line has been monitored with the data...
 Defects of 400 products coming from a factory production line has been monitored with the data shown below. What is the expected number of defects from a production 2 run of 400? Number of defects 0 Frequency 2 3 190 130 1 50 30 10 12 13 14 15 18 20 21 23 25 26 27 28 30 32 Rolling a Die Lottery Ticket Production Defects Roulette O Type here to search
4) Now that Continental can detect more defects before the Silver Box is shipped, I decided...
 4) Now that Continental can detect more defects before the Silver Box is shipped, I decided process Improvements in its circuit board fabrication department would further improve quality. So, for one process they collected the following data this morning to set up a mean control chart. Since the process mean is unknown, estimate the mean and find the UCL and LCL for a 3-sigma mean control chart using this morning's samples. Sample 1 - 24, 24, 25, 22, 21 Sample...
The time to replace vehicle wiper blades at a service center was monitored using a mean...
The time to replace vehicle wiper blades at a service center was monitored using a mean and a range chart. Six samples of n = 20 observations have been obtained and the sample means and ranges computed: Sample Mean Range Sample Mean Range 1 3.06 .42 4 3.13 .46 2 3.15 .50 5 3.06 .46 3 3.11 .41 6 3.09 .45 Factors for three-sigma control limits for and R charts FACTORS FOR R CHARTS Number of Observations in Subgroup, n...
Construct the appropriate three-sigma control chart for the sample observations listed below. Determine the process standard...
Construct the appropriate three-sigma control chart for the sample observations listed below. Determine the process standard deviation Observation 1 2 3 4 5 6 7 8 9 10 11 Number Defects per unit 9 4 3 5 6 3 4 2 3 2 3
 A paper mill uses a control chart to Data on Imperfections in Rolls of Paper monitor the imperfection in finished Total Total Ils of paper. Production output is umber Number of Number Number of of Rolls Imper- Day Produced fections Day Produced fections inspected for twenty days, and the resulting data are shown here. Use these data to set up a control chart for 218 4 12 18 14 nonconformities per roll of paper. Does the process appear to be...
 8 have been gathered with the following results A services process is monitored using x-bar and R charts. Eight samples of n5 observations Sample 2 4 Mean 7.2 7.4 6.6 6.8 7.9 6.0 7.2 6.2 Range .43 .52 .53 20 .36 .42 .35 .42 7 8 Using this data, compute the centerline, the 3 sd upper control limit, and the lower control limits for the x-bar and R charts X-bar R-bar UCL r-bar LCL r-bar UCL x-bar LCL x-bar a....
 Question 3 The time to replace vehicle wiper blades at a service center was monitored using a mean and a range chart. Six samples of n = 20 observations were obtained, and the sample means and ranges computed: Sample Mean Range Sample Mean Range 3.06 .42 4 3.13 46 3.15 .50 3.06 46 3.11 41 3.09 45 Using the factors in the provided table, determine upper and lower limits for mean and range charts. Is the process in control?
 Defects of 400 products coming from a factory production line has been monitored with the data shown below. What is the expected number of defects from a production 2 run of 400? Number of defects 0 Frequency 2 3 190 130 1 50 30 10 12 13 14 15 18 20 21 23 25 26 27 28 30 32 Rolling a Die Lottery Ticket Production Defects Roulette O Type here to search
 4) Now that Continental can detect more defects before the Silver Box is shipped, I decided process Improvements in its circuit board fabrication department would further improve quality. So, for one process they collected the following data this morning to set up a mean control chart. Since the process mean is unknown, estimate the mean and find the UCL and LCL for a 3-sigma mean control chart using this morning's samples. Sample 1 - 24, 24, 25, 22, 21 Sample...
Most questions answered within 3 hours.
-
Where is the error in this code sequence?
String s1 = "Hello";
String s2 = "ello";...
asked 10 months ago -
Financial data for Joel de Paris, Inc., for last year
follow:
Joel de Paris, Inc.
Balance...
asked 10 months ago -
Consider this reaction:
Al2(SO4)3 (aq)+ BaCl3
(aq) Al2Cl6 (aq)- +
3BaSO4(s) . What is the...
asked 10 months ago -
Suppose that Savneet is considering increasing her
recent random sample from 20 car rentals to 40...
asked 10 months ago -
Trucks arrive at an unloading terminal at an average rate of 120
per hour.
Trucks arrive...
asked 10 months ago -
Why are methanol and ethanol completely soluble in water while
octanol is not very little soluble....
asked 10 months ago -
A facilities manager at a university reads in a research report
that the mean amount of...
asked 10 months ago -
When the CuSO4 is rehydrated by adding water to the anhydrous
compound, is this an endothermic...
asked 10 months ago -
A ray of sunlight is passing from diamond into crown glass; the
angle of incidence is...
asked 10 months ago -
A block of mass 0.249 kg is placed on top of a light, vertical
spring of...
asked 10 months ago -
how do the kidneys compensate in the presences of acidosis
a) trigger hyperventilate
b) reserve acid...
asked 10 months ago -
Question 501 pts
The rental rate of capital to the firm increases. Which of the
following...
asked 10 months ago