The time to replace vehicle wiper blades at a service center was monitored using a mean...
|
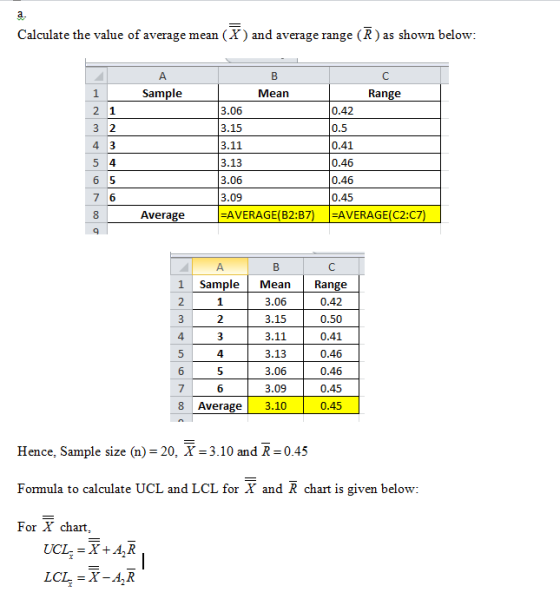
The time to replace vehicle wiper blades at a service center was monitored using a mean and a range chart. Six samples of n = 20 observations have been obtained and the sample means and ranges computed: |
| Sample | Mean | Range | Sample | Mean | Range |
| 1 | 3.06 | .42 | 4 | 3.13 | .46 |
| 2 | 3.15 | .50 | 5 | 3.06 | .46 |
| 3 | 3.11 | .41 | 6 | 3.09 | .45 |
| Factors for
three-sigma control limits for |
|
FACTORS FOR R CHARTS |
|||
| Number of
Observations in Subgroup, n |
Factor
for A2 |
Lower Control Limit, D3 |
Upper Control Limit, D4 |
| 2 | 1.88 | 0 | 3.27 |
| 3 | 1.02 | 0 | 2.57 |
| 4 | 0.73 | 0 | 2.28 |
| 5 | 0.58 | 0 | 2.11 |
| 6 | 0.48 | 0 | 2.00 |
| 7 | 0.42 | 0.08 | 1.92 |
| 8 | 0.37 | 0.14 | 1.86 |
| 9 | 0.34 | 0.18 | 1.82 |
| 10 | 0.31 | 0.22 | 1.78 |
| 11 | 0.29 | 0.26 | 1.74 |
| 12 | 0.27 | 0.28 | 1.72 |
| 13 | 0.25 | 0.31 | 1.69 |
| 14 | 0.24 | 0.33 | 1.67 |
| 15 | 0.22 | 0.35 | 1.65 |
| 16 | 0.21 | 0.36 | 1.64 |
| 17 | 0.20 | 0.38 | 1.62 |
| 18 | 0.19 | 0.39 | 1.61 |
| 19 | 0.19 | 0.40 | 1.60 |
| 20 | 0.18 | 0.41 | 1.59 |
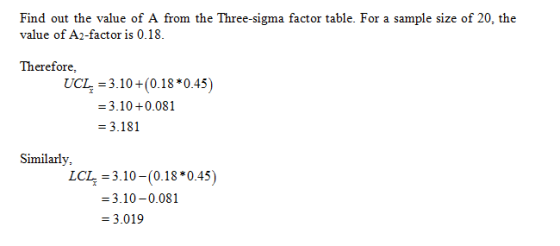
| a. |
Using the factors in the above table, determine upper and lower limits for mean and range charts. (Do not round intermediate calculations. Round your mean value to 3 decimal places and range value to 4 decimal places.) |
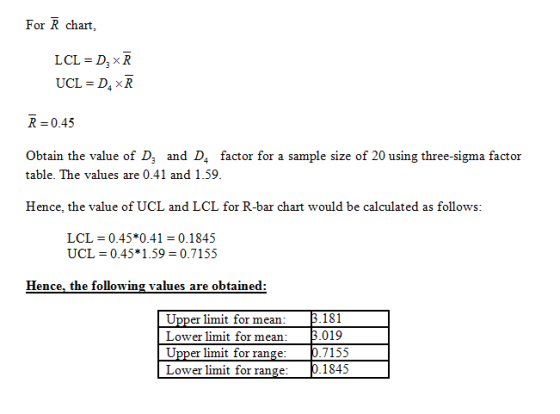
| Upper limit for mean: | |
| Lower limit for mean: | |
| Upper limit for range: | |
| Lower limit for range: | |
Homework Answers
Add Answer to:
The time to replace vehicle wiper blades at a service center was
monitored using a mean...
The time to replace vehicle wiper blades at a service center was monitored using a mean and a range chart.
 Question 3 The time to replace vehicle wiper blades at a service center was monitored using a mean and a range chart. Six samples of n = 20 observations were obtained, and the sample means and ranges computed: Sample Mean Range Sample Mean Range 3.06 .42 4 3.13 46 3.15 .50 3.06 46 3.11 41 3.09 45 Using the factors in the provided table, determine upper and lower limits for mean and range charts. Is the process in control?
Checkout time at a supermarket is monitored using a mean and a range chart. Six samples...
Checkout time at a supermarket is monitored using a mean and a range chart. Six samples of n = 20 observations have been obtained and the sample means and ranges computed: Sample Mean Range Sample Mean Range 1 3.06 .42 4 3.13 .46 2 3.15 .49 5 3.06 .46 3 3.11 .41 6 3.09 .45 Factors for three-sigma control limits for x¯x¯ and R charts FACTORS FOR R CHARTS Number of Observations in Subgroup, n Factor for x¯x¯ Chart, A2 Lower...
Computer upgrades have a nominal time of 80 minutes. Samples of five observations each have been ...
Computer upgrades have a nominal time of 80 minutes. Samples of five observations each have been taken, and the results are as listed. SAMPLE 1 2 3 4 5 6 79.2 80.5 79.6 78.9 80.5 79.7 78.8 78.7 79.6 79.4 79.6 80.6 80.0 81.0 80.4 79.7 80.4 80.5 78.4 80.4 80.3 79.4 80.8 80.0 81.0 80.1 80.8 80.6 78.8 81.1 Factors for three-sigma control limits for x¯ and R charts FACTORS FOR R CHARTS Number of Observations in Subgroup, n...
Problem 8-10 Factor Weight East #1 East #2 West Initial cost 8 130 120 140 Traffic...
Problem 8-10 Factor Weight East #1 East #2 West Initial cost 8 130 120 140 Traffic 8 30 35 50 Maintenance 4 25 15 16 Dock space 4 22 24 13 Neighborhood 2 15 11 9 a. Using the above factor ratings, calculate the composite score for each location. Location Composite Score East #1 East #2 West b. Determine which location has the highest composite score: East #2 West East #1 Problem 8-12 A toy manufacturer produces toys in five...
Question 4 [20 marks] By utilising Annexure A, answer the following questions: (a) 15 samples of...
 Question 4 [20 marks] By utilising Annexure A, answer the following questions: (a) 15 samples of n 8 have been taken from a cleaning operation. The average sample range for the 20 samples was 0.016 minute, and the average mean was 3 minutes. Determine the three-sigma control limits for this process. (4 marks) (b) 15 samples of n 10 observations have been taken from a milling process. The average sample range is 0.01 centimetres. Determine upper and lower control limits...
Problem 10-25 Resistors for electronic circuits are manufactured on a high-speed automated machin...
 Problem 10-25 Resistors for electronic circuits are manufactured on a high-speed automated machine. The machine is set up to produce a large run of resistors of 1,000 ohms each. Use Exhibit 10.13. To set up the machine and to create a control chart to be used throughout the run, 15 samples were taken with four resistors in each sample. The complete list of samples and their measured values are as follows: Use three-sigma control limits READINGS (IN OHMS) 1014 1019...
A teller at a drive-up window at a bank had the following service times (in minutes)...
A teller at a drive-up window at a bank had the following service times (in minutes) for 20 randomly selected customers: SAMPLE 1 2 3 4 4.5 4.6 4.5 4.7 4.2 4.5 4.6 4.6 4.2 4.4 4.4 4.8 4.3 4.7 4.4 4.5 4.3 4.3 4.6 4.9 a. Determine the mean of each sample. (Round your answers to 1 decimal place.) Sample Mean 1 2 3 4 b. If the process parameters are unknown, estimate its mean and standard deviation. (Round...
Checkout times at a drug store are being monitored and the following data has been collected. Each sample contained 20 items. Sample Mean Range 1 3.06 .42 2 3.15 .50 3 3.11 .41 4 3.13 .46...
Checkout times at a drug store are being monitored and the following data has been collected. Each sample contained 20 items. Sample Mean Range 1 3.06 .42 2 3.15 .50 3 3.11 .41 4 3.13 .46 5 3.06 .46 6 3.09 .45 Calculate the lower and upper control limits for the range. (Keep three decimal places) Question 43 options: Lower = 0.191 Upper = 0.664 Lower = 0.716 Upper = 0.175 Lower = 3.109 Upper = 3.211 Lower = 0.185...
An automatic lathe produces rollers for roller bearings, and the process is monitored by statistical process...
 An automatic lathe produces rollers for roller bearings, and the process is monitored by statistical process control charts. The central line of the chart for the sample means is set at 8.40 and for the mean range at 0.3 mm. The process is in control, as established by samples of size 5. The upper and lower specifications for the diameter of the rollers are (8.40 + 0.25) and (8.40 -0.25) mm, respectively. Click the icon to view the table of...
8 have been gathered with the following results A services process is monitored using x-bar and...
 8 have been gathered with the following results A services process is monitored using x-bar and R charts. Eight samples of n5 observations Sample 2 4 Mean 7.2 7.4 6.6 6.8 7.9 6.0 7.2 6.2 Range .43 .52 .53 20 .36 .42 .35 .42 7 8 Using this data, compute the centerline, the 3 sd upper control limit, and the lower control limits for the x-bar and R charts X-bar R-bar UCL r-bar LCL r-bar UCL x-bar LCL x-bar a....
 Question 3 The time to replace vehicle wiper blades at a service center was monitored using a mean and a range chart. Six samples of n = 20 observations were obtained, and the sample means and ranges computed: Sample Mean Range Sample Mean Range 3.06 .42 4 3.13 46 3.15 .50 3.06 46 3.11 41 3.09 45 Using the factors in the provided table, determine upper and lower limits for mean and range charts. Is the process in control?
 Question 4 [20 marks] By utilising Annexure A, answer the following questions: (a) 15 samples of n 8 have been taken from a cleaning operation. The average sample range for the 20 samples was 0.016 minute, and the average mean was 3 minutes. Determine the three-sigma control limits for this process. (4 marks) (b) 15 samples of n 10 observations have been taken from a milling process. The average sample range is 0.01 centimetres. Determine upper and lower control limits...
 Problem 10-25 Resistors for electronic circuits are manufactured on a high-speed automated machine. The machine is set up to produce a large run of resistors of 1,000 ohms each. Use Exhibit 10.13. To set up the machine and to create a control chart to be used throughout the run, 15 samples were taken with four resistors in each sample. The complete list of samples and their measured values are as follows: Use three-sigma control limits READINGS (IN OHMS) 1014 1019...
 An automatic lathe produces rollers for roller bearings, and the process is monitored by statistical process control charts. The central line of the chart for the sample means is set at 8.40 and for the mean range at 0.3 mm. The process is in control, as established by samples of size 5. The upper and lower specifications for the diameter of the rollers are (8.40 + 0.25) and (8.40 -0.25) mm, respectively. Click the icon to view the table of...
 8 have been gathered with the following results A services process is monitored using x-bar and R charts. Eight samples of n5 observations Sample 2 4 Mean 7.2 7.4 6.6 6.8 7.9 6.0 7.2 6.2 Range .43 .52 .53 20 .36 .42 .35 .42 7 8 Using this data, compute the centerline, the 3 sd upper control limit, and the lower control limits for the x-bar and R charts X-bar R-bar UCL r-bar LCL r-bar UCL x-bar LCL x-bar a....
Most questions answered within 3 hours.
-
Where is the error in this code sequence?
String s1 = "Hello";
String s2 = "ello";...
asked 10 months ago -
Financial data for Joel de Paris, Inc., for last year
follow:
Joel de Paris, Inc.
Balance...
asked 10 months ago -
Consider this reaction:
Al2(SO4)3 (aq)+ BaCl3
(aq) Al2Cl6 (aq)- +
3BaSO4(s) . What is the...
asked 10 months ago -
Suppose that Savneet is considering increasing her
recent random sample from 20 car rentals to 40...
asked 10 months ago -
Trucks arrive at an unloading terminal at an average rate of 120
per hour.
Trucks arrive...
asked 10 months ago -
Why are methanol and ethanol completely soluble in water while
octanol is not very little soluble....
asked 10 months ago -
A facilities manager at a university reads in a research report
that the mean amount of...
asked 10 months ago -
When the CuSO4 is rehydrated by adding water to the anhydrous
compound, is this an endothermic...
asked 10 months ago -
A ray of sunlight is passing from diamond into crown glass; the
angle of incidence is...
asked 10 months ago -
A block of mass 0.249 kg is placed on top of a light, vertical
spring of...
asked 10 months ago -
how do the kidneys compensate in the presences of acidosis
a) trigger hyperventilate
b) reserve acid...
asked 10 months ago -
Question 501 pts
The rental rate of capital to the firm increases. Which of the
following...
asked 10 months ago