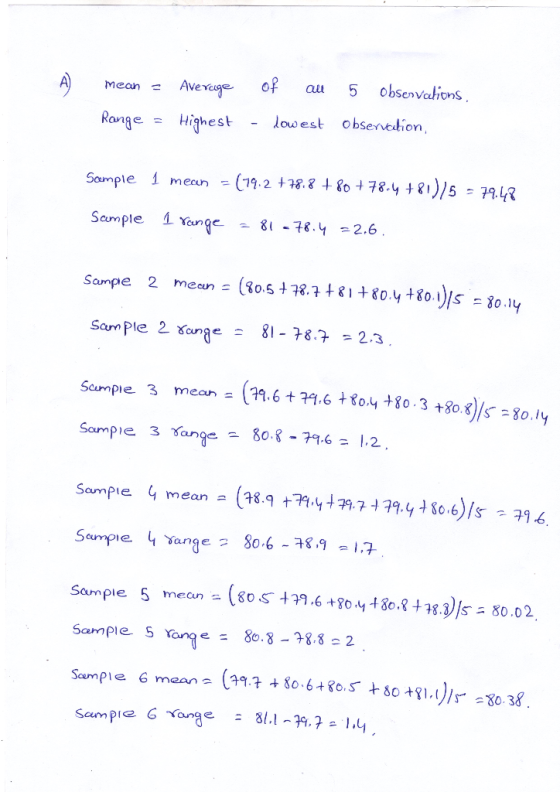
Computer upgrades have a nominal time of 80 minutes. Samples of five observations each have been ...
Computer upgrades have a nominal time of 80 minutes. Samples of
five observations each have been taken, and the results are as
listed.
| SAMPLE | |||||
| 1 | 2 | 3 | 4 | 5 | 6 |
| 79.2 | 80.5 | 79.6 | 78.9 | 80.5 | 79.7 |
| 78.8 | 78.7 | 79.6 | 79.4 | 79.6 | 80.6 |
| 80.0 | 81.0 | 80.4 | 79.7 | 80.4 | 80.5 |
| 78.4 | 80.4 | 80.3 | 79.4 | 80.8 | 80.0 |
| 81.0 | 80.1 | 80.8 | 80.6 | 78.8 | 81.1 |
Factors for three-sigma control limits for x¯
and R charts
|
FACTORS FOR R CHARTS |
||||
| Number of Observations
in Subgroup, n |
Factor
for x¯ |
|||
| Chart, A2 |
Lower Control Limit, D3 |
Upper Control Limit, D4 |
||
| 2 | 1.88 | 0 | 3.27 | |
| 3 | 1.02 | 0 | 2.57 | |
| 4 | 0.73 | 0 | 2.28 | |
| 5 | 0.58 | 0 | 2.11 | |
| 6 | 0.48 | 0 | 2.00 | |
| 7 | 0.42 | 0.08 | 1.92 | |
| 8 | 0.37 | 0.14 | 1.86 | |
| 9 | 0.34 | 0.18 | 1.82 | |
| 10 | 0.31 | 0.22 | 1.78 | |
| 11 | 0.29 | 0.26 | 1.74 | |
| 12 | 0.27 | 0.28 | 1.72 | |
| 13 | 0.25 | 0.31 | 1.69 | |
| 14 | 0.24 | 0.33 | 1.67 | |
| 15 | 0.22 | 0.35 | 1.65 | |
| 16 | 0.21 | 0.36 | 1.64 | |
| 17 | 0.20 | 0.38 | 1.62 | |
| 18 | 0.19 | 0.39 | 1.61 | |
| 19 | 0.19 | 0.40 | 1.60 | |
| 20 | 0.18 | 0.41 | 1.59 | |
a. Using factors from above table, determine upper and
lower control limits for mean and range charts. (Round your
intermediate calculations and final answers to 2 decimal places.
Leave no cells blank - be certain to enter "0" wherever
required.)
| Mean Chart | Range Chart | |
| UCL | ||
| LCL | ||
b. Decide if the process is in control.
-
Yes
-
No
Homework Answers

Add Answer to:
Computer upgrades have a nominal time of 80 minutes. Samples of five observations each have been ...
Samples of five observations have been taken and are shown below: Sample 79.2 78.8 80.0 78.4...
 Samples of five observations have been taken and are shown below: Sample 79.2 78.8 80.0 78.4 81.0 80.5 78.7 81.0 80.4 80.1 79.6 79.6 80.4 80.3 80.8 78.9 79.4 79.7 79.4 80.6 80.5 79.6 80.4 80.8 78.8 79.7 80.6 80.5 80.0 81.1 Determine upper and lower control limits. Round all intermediate values to a maximum of three decimals. Round Mean and Range chart control limits to three decimals.
Specifications for the computer upgrades are 76 minutes and 81 minutes. Estimate the percentage of process...
Specifications for the computer upgrades are 76 minutes and 81 minutes. Estimate the percentage of process output that can be expected to fall within the specifications. (Round your answer to 1 decimal place. Omit the "%" sign in your response.) SAMPLE 1 2 3 4 5 6 79.2 80.1 79.6 78.9 80.4 79.7 79.7 78.7 79.6 78.7 79.6 80.6 80.0 81.0 80.2 79.7 80.4 80.5 78.4 80.4 80.3 79.4 78.8 80.0 81.0 80.1 80.8 80.6 78.8 81.1
Specifications for the computer upgrades are 76 minutes and 81 minutes. Estimate the percentage of process...
Specifications for the computer upgrades are 76 minutes and 81 minutes. Estimate the percentage of process output that can be expected to fall within the specifications. (Round your answer to 1 decimal place. Omit the "%" sign in your response.) SAMPLE 1 2 3 4 5 6 79.2 78.4 79.6 78.9 80.5 79.7 81.9 78.7 79.6 79.8 79.6 80.6 80.0 81.0 78.9 79.7 80.4 79.1 78.4 80.4 80.3 79.4 78.5 80.0 81.0 80.1 80.8 80.6 78.8 81.1 Expected process output ...
Specfications for the computer upgrades are 78 minutes and 81 minutes Estimate the percentage of process...
 Specfications for the computer upgrades are 78 minutes and 81 minutes Estimate the percentage of process output that can be expected to fall within the specifications. Hint. The normality assumption does not hold. (Round your answer to 1 decimal place. Omit the "%" sign in your response.) SAMPLE 4 6 79.2 80.5 79.6 78.9 80.5 79.7 78.8 78.7 79.6 79.4 79.6 8e.6 80.0 81.0 80.4 79.7 80.4 80.s 78.4 80.4 80.3 79.4 80.8 8e.e 81.0 80.1 80.8 8.6 78.8 81.1...
Specifications for the computer upgrades are 77 minutes and 81 minutes. Estimate the percentage of process...
 Specifications for the computer upgrades are 77 minutes and 81 minutes. Estimate the percentage of process output that can be expected to fall within the specifications. (Round your answer to 1 decimal place. Omit the "%" sign in your response.) SAMPLE $$ \begin{array}{cccccc} 1 & 2 & 3 & 4 & 5 & 6 \\ 79.2 & 83.2 & 79.6 & 78.9 & 80.8 & 79.7 \\ 80.3 & 78.7 & 79.6 & 79.2 & 79.6 & 80.6 \\ 80.0 & 81.0...
Specifications for the computer upgrades are 76 minutes and 81 minutes. Estimate the percentage of process...
 Specifications for the computer upgrades are 76 minutes and 81 minutes. Estimate the percentage of process output that can be expected to fall within the specifications. (Round your answer to 1 decimal place. Omit the "%" sign in your response.) SAMPLE 79.2 79.6 79.6 78.9 80.2 79.7 80.0 78.7 79.6 80.3 79-6 80.6 80.0 81.0 79.0 79.7 80.4 80.8 78.4 80.4 80.3 79-4 80.9 80.0 81.0 80.1 80.8 80.6 78.8 81.1 -96 Expected process output
Q1[10 pts]. Computer upgrades have a targeted time of 80 minutes. Six samples of 5 observations each have been taken, and the results are listed below. Determine the appropriate 98% control chart(s)...
 Q1[10 pts]. Computer upgrades have a targeted time of 80 minutes. Six samples of 5 observations each have been taken, and the results are listed below. Determine the appropriate 98% control chart(s) for monitoring the process. Is the process stable (i.e., in-control)? 2 3 4 6 80 79.5 79.4 79.3 79 80.2 80.1 80 80.5 79.6 79 78.2 80 81.2 80.9 80.5 79.9 80.4 80.1 81 78.9 81 81.1 80.1 81 82 79.8 80.4 79.6
Q1[10 pts]. Computer upgrades have...
Q1[10 pts]. Computer upgrades have a targeted time of 80 minutes. Six samples of 5 observations each have been taken, and the results are listed below. Determine the appropriate 98% control chart(s) for monitoring the process. Is the process stable (i.e., in-control)? 2 3 4 6 80 79.5 79.4 79.3 79 80.2 80.1 80 80.5 79.6 79 78.2 80 81.2 80.9 80.5 79.9 80.4 80.1 81 78.9 81 81.1 80.1 81 82 79.8 80.4 79.6
Q1[10 pts]. Computer upgrades have...
Checkout time at a supermarket is monitored using a mean and a range chart. Six samples...
Checkout time at a supermarket is monitored using a mean and a range chart. Six samples of n = 20 observations have been obtained and the sample means and ranges computed: Sample Mean Range Sample Mean Range 1 3.06 .42 4 3.13 .46 2 3.15 .49 5 3.06 .46 3 3.11 .41 6 3.09 .45 Factors for three-sigma control limits for x¯x¯ and R charts FACTORS FOR R CHARTS Number of Observations in Subgroup, n Factor for x¯x¯ Chart, A2 Lower...
The time to replace vehicle wiper blades at a service center was monitored using a mean...
The time to replace vehicle wiper blades at a service center was monitored using a mean and a range chart. Six samples of n = 20 observations have been obtained and the sample means and ranges computed: Sample Mean Range Sample Mean Range 1 3.06 .42 4 3.13 .46 2 3.15 .50 5 3.06 .46 3 3.11 .41 6 3.09 .45 Factors for three-sigma control limits for and R charts FACTORS FOR R CHARTS Number of Observations in Subgroup, n...
 Samples of five observations have been taken and are shown below: Sample 79.2 78.8 80.0 78.4 81.0 80.5 78.7 81.0 80.4 80.1 79.6 79.6 80.4 80.3 80.8 78.9 79.4 79.7 79.4 80.6 80.5 79.6 80.4 80.8 78.8 79.7 80.6 80.5 80.0 81.1 Determine upper and lower control limits. Round all intermediate values to a maximum of three decimals. Round Mean and Range chart control limits to three decimals.
 Specfications for the computer upgrades are 78 minutes and 81 minutes Estimate the percentage of process output that can be expected to fall within the specifications. Hint. The normality assumption does not hold. (Round your answer to 1 decimal place. Omit the "%" sign in your response.) SAMPLE 4 6 79.2 80.5 79.6 78.9 80.5 79.7 78.8 78.7 79.6 79.4 79.6 8e.6 80.0 81.0 80.4 79.7 80.4 80.s 78.4 80.4 80.3 79.4 80.8 8e.e 81.0 80.1 80.8 8.6 78.8 81.1...
 Specifications for the computer upgrades are 77 minutes and 81 minutes. Estimate the percentage of process output that can be expected to fall within the specifications. (Round your answer to 1 decimal place. Omit the "%" sign in your response.) SAMPLE $$ \begin{array}{cccccc} 1 & 2 & 3 & 4 & 5 & 6 \\ 79.2 & 83.2 & 79.6 & 78.9 & 80.8 & 79.7 \\ 80.3 & 78.7 & 79.6 & 79.2 & 79.6 & 80.6 \\ 80.0 & 81.0...
 Specifications for the computer upgrades are 76 minutes and 81 minutes. Estimate the percentage of process output that can be expected to fall within the specifications. (Round your answer to 1 decimal place. Omit the "%" sign in your response.) SAMPLE 79.2 79.6 79.6 78.9 80.2 79.7 80.0 78.7 79.6 80.3 79-6 80.6 80.0 81.0 79.0 79.7 80.4 80.8 78.4 80.4 80.3 79-4 80.9 80.0 81.0 80.1 80.8 80.6 78.8 81.1 -96 Expected process output
 Q1[10 pts]. Computer upgrades have a targeted time of 80 minutes. Six samples of 5 observations each have been taken, and the results are listed below. Determine the appropriate 98% control chart(s) for monitoring the process. Is the process stable (i.e., in-control)? 2 3 4 6 80 79.5 79.4 79.3 79 80.2 80.1 80 80.5 79.6 79 78.2 80 81.2 80.9 80.5 79.9 80.4 80.1 81 78.9 81 81.1 80.1 81 82 79.8 80.4 79.6
Q1[10 pts]. Computer upgrades have...
Q1[10 pts]. Computer upgrades have a targeted time of 80 minutes. Six samples of 5 observations each have been taken, and the results are listed below. Determine the appropriate 98% control chart(s) for monitoring the process. Is the process stable (i.e., in-control)? 2 3 4 6 80 79.5 79.4 79.3 79 80.2 80.1 80 80.5 79.6 79 78.2 80 81.2 80.9 80.5 79.9 80.4 80.1 81 78.9 81 81.1 80.1 81 82 79.8 80.4 79.6
Q1[10 pts]. Computer upgrades have...
Most questions answered within 3 hours.
-
Where is the error in this code sequence?
String s1 = "Hello";
String s2 = "ello";...
asked 10 months ago -
Financial data for Joel de Paris, Inc., for last year
follow:
Joel de Paris, Inc.
Balance...
asked 10 months ago -
Consider this reaction:
Al2(SO4)3 (aq)+ BaCl3
(aq) Al2Cl6 (aq)- +
3BaSO4(s) . What is the...
asked 10 months ago -
Suppose that Savneet is considering increasing her
recent random sample from 20 car rentals to 40...
asked 10 months ago -
Trucks arrive at an unloading terminal at an average rate of 120
per hour.
Trucks arrive...
asked 10 months ago -
Why are methanol and ethanol completely soluble in water while
octanol is not very little soluble....
asked 10 months ago -
A facilities manager at a university reads in a research report
that the mean amount of...
asked 10 months ago -
When the CuSO4 is rehydrated by adding water to the anhydrous
compound, is this an endothermic...
asked 10 months ago -
A ray of sunlight is passing from diamond into crown glass; the
angle of incidence is...
asked 10 months ago -
A block of mass 0.249 kg is placed on top of a light, vertical
spring of...
asked 10 months ago -
how do the kidneys compensate in the presences of acidosis
a) trigger hyperventilate
b) reserve acid...
asked 10 months ago -
Question 501 pts
The rental rate of capital to the firm increases. Which of the
following...
asked 10 months ago