Short Answer Question 3: The daily net cash flows in the table
below represent a 5-day sample. Use the Data Analysis tool in Excel
to calculate the 95% and 99% confidence intervals for the daily net
cash flows. Along with your calculation, interpret the meaning
behind your confidence interval estimates and discuss why the 99%
confidence interval is wider. 
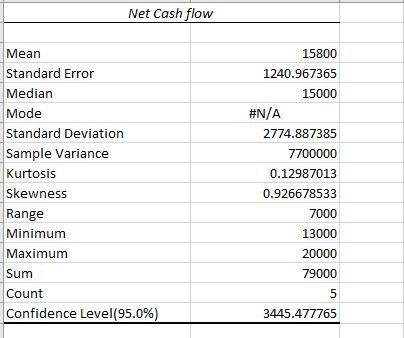
Homework Answers
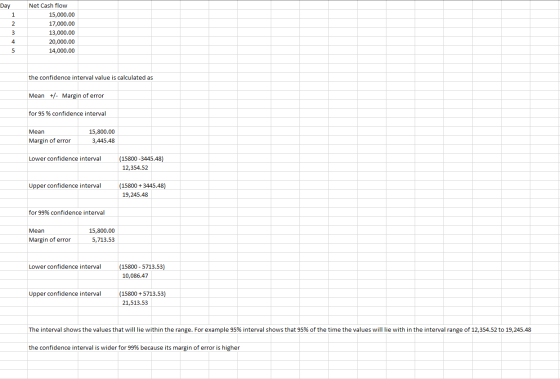
excel output for 95% confidence interval
for 99% confidence interval

Add Answer to:
Short Answer Question 3: The daily net cash flows in the table
below represent a 5-day...
The daily net cash flows in the table below represent a 5-day sample. Use the Data...
The daily net cash flows in the table below represent a 5-day sample. Use the Data Analysis tool in Excel to calculate the 95% and 99% confidence intervals for the daily net cash flows. Along with your calculation, interpret the meaning behind your confidence interval estimates and discuss why the 99% confidence interval is wider. Day Net Cash Flow 1 15,000 2 17,000 3 13,000 4 20,000 5 14,000
What is the Net Present Value of the following cash flows which represent expected benefits from...
 What is the Net Present Value of the following cash flows which
represent expected benefits from opening a small ice cream business
part time. You are expecting a return of 20%, and you must invest
$60,000 at the start. Fill in the chart below. Determine the IRR
using Excel. Interpret the results in view of your expectations for
this project.
PV Year | Cash Flow T 1 5,000 9,000 10,000 10,000 12,000 14,000 7 101,500 Present Value NPV (Est IRR)...
What is the Net Present Value of the following cash flows which
represent expected benefits from opening a small ice cream business
part time. You are expecting a return of 20%, and you must invest
$60,000 at the start. Fill in the chart below. Determine the IRR
using Excel. Interpret the results in view of your expectations for
this project.
PV Year | Cash Flow T 1 5,000 9,000 10,000 10,000 12,000 14,000 7 101,500 Present Value NPV (Est IRR)...
D Question 11 3 pts For the net cash flows shown in the table below, the...
 D Question 11 3 pts For the net cash flows shown in the table below, the number of possible rate of return solutions according to the Descarte's rule is: Year Net Cash flow, $ -$50,000 $20,000 $40,000 3 -$5,000 $30,000 $40,000 $2,000 1 .0 3 2.
Question Help The accompanying data represent the total travel tax (in dollars) for a 3-day business...
 Question Help The accompanying data represent the total travel tax (in dollars) for a 3-day business trip in 8 randomly selected cities. A normal probability plot suggests the data could come from a population that is normally distributed A baxplot indicates there are no outliers. Complete parts (a) through (c) below. 69.59 79.03 69.36 82 32 82 68 87.39 101.74 97 97 (a) Determine a point estimate for the population mean travel tax A point estimate for the population mean...
Net cash provided by (used for) investing activities 3. Calculate the net cash flow from financing...
 Net cash provided by (used for) investing activities 3. Calculate the net cash flow from financing activities for the year. (If a box is not used in the statement, leave the box empty; do not select a label or enter a zero. Use parentheses or a minus sign for numbers to be subtracted or net cash outflows.) Financing Activities: (12) (13) (14) Net cash provided by (used for) financing activities 4. What was the net change in cash for the...
put together a Spreadsheet for Statement of Cash Flows for the same problem 16B-45B. Format the...
 put together a Spreadsheet for Statement of Cash Flows for the
same problem 16B-45B. Format the spreadsheet as shown in Exhibit
16B-1.
P16B-45B Using a spreadsheet to prepare the statement of cash flows-indirect method The 2018 comparative balance sheet and income statement of Attleboro Group, Inc. follow. Attleboro disposed of a plant asset at book value in 2018. ATTLEBORO GROUP, INC. Income Statement Year Ended December 31, 2018 $441,000 205,400 235,600 $ 76,300 15,300 49,600 Net Sales Revenue Cost of...
put together a Spreadsheet for Statement of Cash Flows for the
same problem 16B-45B. Format the spreadsheet as shown in Exhibit
16B-1.
P16B-45B Using a spreadsheet to prepare the statement of cash flows-indirect method The 2018 comparative balance sheet and income statement of Attleboro Group, Inc. follow. Attleboro disposed of a plant asset at book value in 2018. ATTLEBORO GROUP, INC. Income Statement Year Ended December 31, 2018 $441,000 205,400 235,600 $ 76,300 15,300 49,600 Net Sales Revenue Cost of...
CHAPTER 12 Statement of Cash Flows 593 Required: LO 12-1, 12-2, 12-3, 124, 12-5 Determine whether...
 CHAPTER 12 Statement of Cash Flows 593 Required: LO 12-1, 12-2, 12-3, 124, 12-5 Determine whether the following account balances increased (I) or decreased (D) during the period: (a) Accounts Receivable. (h) Inventories. (c) Accounts Payable, and (d) Accrued Liabilities. E12-13 Preparing and Evaluating a Statement of Cash Flows (Indirect Method) from Comparative Balance Sheets and Income Statements Consultex, Inc. was founded in 2015 as a small financial consulting business. The company had done reasonably well in 2015-2017 but started...
Please help with the case study comprehensive question for 5-36. Pictures Below. You are the loan...
 Please help with the case study comprehensive question for 5-36.
Pictures Below.
You are the loan officer at QIB responsible for determining whether BBCC's business is strong enough to be able to repay the loan. To do so, accomplish the following: a. Calculate the following ratios for 2017 and 2018, compare with the industry averages shown in parentheses, and indicate if the company is doing better or worse than the industry and whether the performance is improving or deteriorating in...
Please help with the case study comprehensive question for 5-36.
Pictures Below.
You are the loan officer at QIB responsible for determining whether BBCC's business is strong enough to be able to repay the loan. To do so, accomplish the following: a. Calculate the following ratios for 2017 and 2018, compare with the industry averages shown in parentheses, and indicate if the company is doing better or worse than the industry and whether the performance is improving or deteriorating in...
 What is the Net Present Value of the following cash flows which
represent expected benefits from opening a small ice cream business
part time. You are expecting a return of 20%, and you must invest
$60,000 at the start. Fill in the chart below. Determine the IRR
using Excel. Interpret the results in view of your expectations for
this project.
PV Year | Cash Flow T 1 5,000 9,000 10,000 10,000 12,000 14,000 7 101,500 Present Value NPV (Est IRR)...
What is the Net Present Value of the following cash flows which
represent expected benefits from opening a small ice cream business
part time. You are expecting a return of 20%, and you must invest
$60,000 at the start. Fill in the chart below. Determine the IRR
using Excel. Interpret the results in view of your expectations for
this project.
PV Year | Cash Flow T 1 5,000 9,000 10,000 10,000 12,000 14,000 7 101,500 Present Value NPV (Est IRR)...
 D Question 11 3 pts For the net cash flows shown in the table below, the number of possible rate of return solutions according to the Descarte's rule is: Year Net Cash flow, $ -$50,000 $20,000 $40,000 3 -$5,000 $30,000 $40,000 $2,000 1 .0 3 2.
 Question Help The accompanying data represent the total travel tax (in dollars) for a 3-day business trip in 8 randomly selected cities. A normal probability plot suggests the data could come from a population that is normally distributed A baxplot indicates there are no outliers. Complete parts (a) through (c) below. 69.59 79.03 69.36 82 32 82 68 87.39 101.74 97 97 (a) Determine a point estimate for the population mean travel tax A point estimate for the population mean...
 Net cash provided by (used for) investing activities 3. Calculate the net cash flow from financing activities for the year. (If a box is not used in the statement, leave the box empty; do not select a label or enter a zero. Use parentheses or a minus sign for numbers to be subtracted or net cash outflows.) Financing Activities: (12) (13) (14) Net cash provided by (used for) financing activities 4. What was the net change in cash for the...
 put together a Spreadsheet for Statement of Cash Flows for the
same problem 16B-45B. Format the spreadsheet as shown in Exhibit
16B-1.
P16B-45B Using a spreadsheet to prepare the statement of cash flows-indirect method The 2018 comparative balance sheet and income statement of Attleboro Group, Inc. follow. Attleboro disposed of a plant asset at book value in 2018. ATTLEBORO GROUP, INC. Income Statement Year Ended December 31, 2018 $441,000 205,400 235,600 $ 76,300 15,300 49,600 Net Sales Revenue Cost of...
put together a Spreadsheet for Statement of Cash Flows for the
same problem 16B-45B. Format the spreadsheet as shown in Exhibit
16B-1.
P16B-45B Using a spreadsheet to prepare the statement of cash flows-indirect method The 2018 comparative balance sheet and income statement of Attleboro Group, Inc. follow. Attleboro disposed of a plant asset at book value in 2018. ATTLEBORO GROUP, INC. Income Statement Year Ended December 31, 2018 $441,000 205,400 235,600 $ 76,300 15,300 49,600 Net Sales Revenue Cost of...
 CHAPTER 12 Statement of Cash Flows 593 Required: LO 12-1, 12-2, 12-3, 124, 12-5 Determine whether the following account balances increased (I) or decreased (D) during the period: (a) Accounts Receivable. (h) Inventories. (c) Accounts Payable, and (d) Accrued Liabilities. E12-13 Preparing and Evaluating a Statement of Cash Flows (Indirect Method) from Comparative Balance Sheets and Income Statements Consultex, Inc. was founded in 2015 as a small financial consulting business. The company had done reasonably well in 2015-2017 but started...
 Please help with the case study comprehensive question for 5-36.
Pictures Below.
You are the loan officer at QIB responsible for determining whether BBCC's business is strong enough to be able to repay the loan. To do so, accomplish the following: a. Calculate the following ratios for 2017 and 2018, compare with the industry averages shown in parentheses, and indicate if the company is doing better or worse than the industry and whether the performance is improving or deteriorating in...
Please help with the case study comprehensive question for 5-36.
Pictures Below.
You are the loan officer at QIB responsible for determining whether BBCC's business is strong enough to be able to repay the loan. To do so, accomplish the following: a. Calculate the following ratios for 2017 and 2018, compare with the industry averages shown in parentheses, and indicate if the company is doing better or worse than the industry and whether the performance is improving or deteriorating in...
Most questions answered within 3 hours.
-
Where is the error in this code sequence?
String s1 = "Hello";
String s2 = "ello";...
asked 10 months ago -
Financial data for Joel de Paris, Inc., for last year
follow:
Joel de Paris, Inc.
Balance...
asked 10 months ago -
Consider this reaction:
Al2(SO4)3 (aq)+ BaCl3
(aq) Al2Cl6 (aq)- +
3BaSO4(s) . What is the...
asked 10 months ago -
Suppose that Savneet is considering increasing her
recent random sample from 20 car rentals to 40...
asked 10 months ago -
Trucks arrive at an unloading terminal at an average rate of 120
per hour.
Trucks arrive...
asked 10 months ago -
Why are methanol and ethanol completely soluble in water while
octanol is not very little soluble....
asked 10 months ago -
A facilities manager at a university reads in a research report
that the mean amount of...
asked 10 months ago -
When the CuSO4 is rehydrated by adding water to the anhydrous
compound, is this an endothermic...
asked 10 months ago -
A ray of sunlight is passing from diamond into crown glass; the
angle of incidence is...
asked 10 months ago -
A block of mass 0.249 kg is placed on top of a light, vertical
spring of...
asked 10 months ago -
how do the kidneys compensate in the presences of acidosis
a) trigger hyperventilate
b) reserve acid...
asked 10 months ago -
Question 501 pts
The rental rate of capital to the firm increases. Which of the
following...
asked 10 months ago