Please complete this clinical life table showing details (steps; calculation) for the first row.
please do fill out all chart!!
total 2456 patients
Thank you :)
Homework Answers
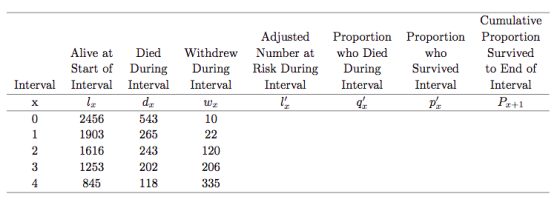
The different components of a clinical life table are as follows:

 number of alive at the start of interval;
  number of deaths during the time interval;
  withdrew during the interval;
  adjusted number at risk during the interval and is given by,
 ;
;  proportion died during the interval and is given by,
  ;
;  proportion who survived during the interval and is given
by,
proportion who survived during the interval and is given
by, ;
;  cumulative proportionsurvived to the end of interval and is given
by,
cumulative proportionsurvived to the end of interval and is given
by,  ; but at the beginning, P(1)=0.
| Interval (x) | Alive at the start of interval
|
Died during interval
|
Withdrew during interval
|
Adjusted number at risk during interval
|
Proportion who died during interval
|
Proportion who survived during interval
|
Cumulative proportionsurvived
to the end of interval
|
| 0 | 2456 | 543 | 10 |  |
 |
 |
 |
| 1 | 1903 | 265 | 22 |  |
 |
 |
 |
| 2 | 1616 | 243 | 120 |  |
 |
 |
 |
| 3 | 1253 | 202 | 206 |  |
 |
 |
 |
| 4 | 845 | 118 | 335 |  |
 |
 |
 |
Add Answer to:
Please complete this clinical life table showing details (steps;
calculation) for the first row.
please do...
complete the following life table and answer the questions 13. Complete the following life table and...
 complete the following life table and answer the
questions
13. Complete the following life table and answer the questions below. (10 pts.) 1(x) 31d.) 4w.) 2 (1.) Alive at beginning Died during year 5(1.) Effective number exposed to Risk of dying during Withdrew during year 649.) Proportion who died during of 7 p.) 8(Px) Proportion Cumulative who did not proportion who die during survived from enroll. year lada) to end of year year year 50 50 Year after Diagnosis 1...
complete the following life table and answer the
questions
13. Complete the following life table and answer the questions below. (10 pts.) 1(x) 31d.) 4w.) 2 (1.) Alive at beginning Died during year 5(1.) Effective number exposed to Risk of dying during Withdrew during year 649.) Proportion who died during of 7 p.) 8(Px) Proportion Cumulative who did not proportion who die during survived from enroll. year lada) to end of year year year 50 50 Year after Diagnosis 1...
Most questions answered within 3 hours.
-
Where is the error in this code sequence?
String s1 = "Hello";
String s2 = "ello";...
asked 10 months ago -
Financial data for Joel de Paris, Inc., for last year
follow:
Joel de Paris, Inc.
Balance...
asked 10 months ago -
Consider this reaction:
Al2(SO4)3 (aq)+ BaCl3
(aq) Al2Cl6 (aq)- +
3BaSO4(s) . What is the...
asked 10 months ago -
Suppose that Savneet is considering increasing her
recent random sample from 20 car rentals to 40...
asked 10 months ago -
Trucks arrive at an unloading terminal at an average rate of 120
per hour.
Trucks arrive...
asked 10 months ago -
Why are methanol and ethanol completely soluble in water while
octanol is not very little soluble....
asked 10 months ago -
A facilities manager at a university reads in a research report
that the mean amount of...
asked 10 months ago -
When the CuSO4 is rehydrated by adding water to the anhydrous
compound, is this an endothermic...
asked 10 months ago -
A ray of sunlight is passing from diamond into crown glass; the
angle of incidence is...
asked 10 months ago -
A block of mass 0.249 kg is placed on top of a light, vertical
spring of...
asked 10 months ago -
how do the kidneys compensate in the presences of acidosis
a) trigger hyperventilate
b) reserve acid...
asked 10 months ago -
Question 501 pts
The rental rate of capital to the firm increases. Which of the
following...
asked 10 months ago