Condensed financial data of Swifty Company for 2020 and 2019 are
presented below.
Additional information:
During the year, $70 of common stock was issued in exchange for
plant assets. No plant assets were sold in 2020.
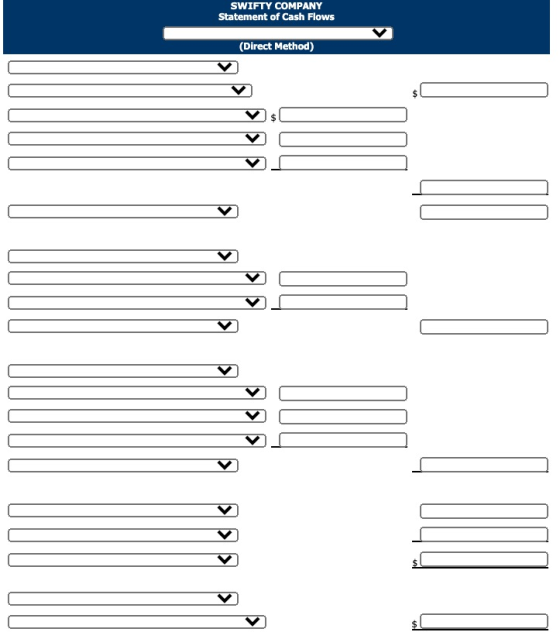
Prepare a statement of cash flows using the direct method.
(Show amounts in the investing and financing sections
that decrease cash flow with either a - sign e.g. -15,000 or in
parenthesis e.g. (15,000).)
Homework Answers
| SWIFTY COMPANY | |||
| Statement of Cash flows | |||
| For the Year Ended December 31, 2020 | |||
| (Direct method) | |||
| Cash flows from operating activities | |||
| Cash received from customers | $ 6,340 | 6820+1280-1760 | |
| Cash paid to suppliers | $ (4,030) | 4600+920-1230+1620-1880 | |
| Cash paid for selling and administrative expenses | $ (900) | 910+250-210-(1210-1160) | |
| Cash paid for income tax expenses | $ (540) | ||
| $ (5,470) | |||
| Net cash cash flow from operating activities | $ 870 | ||
| Cash flows from investing activities | |||
| Cash paid for purchase of plant assets | $ (170) | 1670-1910+70 | |
| Cash received from sale of long term investment | $ 190 | 1440-1330+80 | |
| Net cash flow from investing activities | $ 20 | ||
| Cash flows from financing activities | |||
| Cash paid for dividends | $ (260) | ||
| Cash paid to retire bonds payable | $ (190) | ||
| Cash received from issuance of common stock | $ 170 | 1920-1680-70 | |
| Net cash flow used by financing activities | $ (280) | ||
| Change in cash | $ 610 | ||
| Cash and cash equivalents at beginning of period | $ 1,170 | ||
| Cash and cash equivalents at end of period | $ 1,780 | ||
| Non cash investing and financing activities | |||
| Acquisition of plant assets by issuing common stock | $ 70 | ||
You can reach me over comment box, if you have any doubts.
Please rate this answer
Add Answer to:
Condensed financial data of Swifty Company for 2020 and 2019 are
presented below.
Additional information:
During...
Condensed financial data of Blue Company for 2017 and 2016 are presented below. Additional information: During...
 Condensed financial data of Blue Company for 2017 and 2016 are
presented below.
Additional information:
During the year, $70 of common stock was issued in exchange for
plant assets. No plant assets were sold in 2017.
Prepare a statement of cash flows using the indirect method.
BLUE COMPANY COMPARATIVE BALANCE SHEET AS OF DECEMBER 31, 2017 AND 2016 2017 2016 Cash $1,780 $1,170 Receivables 1,760 1,280 Inventory 1,620 1,880 Plant assets 1,910 1,670 Accumulated depreciation (1,210) (1,160 ) Long-term investments...
Condensed financial data of Blue Company for 2017 and 2016 are
presented below.
Additional information:
During the year, $70 of common stock was issued in exchange for
plant assets. No plant assets were sold in 2017.
Prepare a statement of cash flows using the indirect method.
BLUE COMPANY COMPARATIVE BALANCE SHEET AS OF DECEMBER 31, 2017 AND 2016 2017 2016 Cash $1,780 $1,170 Receivables 1,760 1,280 Inventory 1,620 1,880 Plant assets 1,910 1,670 Accumulated depreciation (1,210) (1,160 ) Long-term investments...
Condensed financial data of Oriole Company for 2020 and 2019 are presented below. ORIOLE COMPANY COMPARATIVE...
 Condensed financial data of Oriole Company for 2020 and 2019 are
presented below.
ORIOLE COMPANY COMPARATIVE BALANCE SHEET AS OF DECEMBER 31, 2020 AND 2019 2020 Cash $1,810 Receivables 1,790 Inventory 1,570 Plant assets 1,870 Accumulated depreciation (1,230 ) Long-term investments (held-to-maturity) 1,300 $7,110 2019 $1,120 1,330 1,940 1,740 (1,150 ) 1,440 $6,420 Accounts payable Accrued liabilities Bonds payable Common stock Retained earnings $1,220 200 1,370 1,860 2,460 $7,110 $910 260 1,550 1,740 1,960 $6,420 ORIOLE COMPANY INCOME STATEMENT FOR...
Condensed financial data of Oriole Company for 2020 and 2019 are
presented below.
ORIOLE COMPANY COMPARATIVE BALANCE SHEET AS OF DECEMBER 31, 2020 AND 2019 2020 Cash $1,810 Receivables 1,790 Inventory 1,570 Plant assets 1,870 Accumulated depreciation (1,230 ) Long-term investments (held-to-maturity) 1,300 $7,110 2019 $1,120 1,330 1,940 1,740 (1,150 ) 1,440 $6,420 Accounts payable Accrued liabilities Bonds payable Common stock Retained earnings $1,220 200 1,370 1,860 2,460 $7,110 $910 260 1,550 1,740 1,960 $6,420 ORIOLE COMPANY INCOME STATEMENT FOR...
Exercise 23-11 Condensed financial data of Crane Company for 2017 and 2016 are presented below. CRANE...
Exercise 23-11 Condensed financial data of Crane Company for 2017 and 2016 are presented below. CRANE COMPANY COMPARATIVE BALANCE SHEET AS OF DECEMBER 31, 2017 AND 2016 2017 2016 Cash $1,760 $1,180 Receivables 1,780 1,280 Inventory 1,610 1,920 Plant assets 1,880 1,660 Accumulated depreciation (1,220 ) (1,190 ) Long-term investments (held-to-maturity) 1,310 1,400 $7,120 $6,250 Accounts payable $1,170 $880 Accrued liabilities 190 240 Bonds payable 1,390 1,540 Common stock 1,910 1,730 Retained earnings 2,460 1,860 $7,120 $6,250 CRANE COMPANY INCOME...
Condensed financial data of Swifty Company for 2017 and 2016 are presented below. SWIFTY COMPANY COMPARATIVE BALANCE SHEET AS OF DECEMBER 31,2017 AND 2016 2017 2016 1.840 $1,170 Cash 1,730 1,310 Rece...
 Condensed financial data of Swifty Company for 2017 and 2016 are presented below. SWIFTY COMPANY COMPARATIVE BALANCE SHEET AS OF DECEMBER 31,2017 AND 2016 2017 2016 1.840 $1,170 Cash 1,730 1,310 Receivables 1,580 1,880 Inventory ,910 1,700 Plant assets 1.210) (1,170) Accumulated depreciation Long-term investments (held-to-maturity) 1.310 1420 $7,160 $6,310 Accounts payable $1.190 $900 210 Accrued liabilities 260 Bonds payable 1400 1,580 Common stock 1,880 1,720 2,480 1,850 Retained earnings $7,160 $6,310 SWIFTY COMPANY INCOME STATEMENT FOR THE YEAR ENDED...
Condensed financial data of Teal Company for 2020 and 2019 are presented below. TEAL COMPANY COMPARATIVE...
 Condensed financial data of Teal Company for 2020 and 2019 are presented below. TEAL COMPANY COMPARATIVE BALANCE SHEET AS OF DECEMBER 31, 2020 AND 2019 2020 2019 Cash $1,830 $1,180 Receivables 1.710 1,320 Inventory 1,590 1,920 Plant assets 1,890 1.710 Accumulated depreciation (1.220) (1.190) Long-term investments (held-to-maturity] 1,320 1.440 $7.120 $6,380 $1,190 $890 210 260 Accounts payable Accrued liabilities Bonds payable Common stock Retained earnings 1,400 1,580 1.940 1,660 2.380 1.990 $7.120 $6,380 TEAL COMPANY INCOME STATEMENT FOR THE YEAR...
Exercise 23-12 Condensed financial data of Stellar Company for 2017 and 2016 are present STELLAR COMPANY...
 Exercise 23-12 Condensed financial data of Stellar Company for 2017 and 2016 are present STELLAR COMPANY COMPARATIVE BALANCE SHEET AS OF DECEMBER 31, 2017 AND 2016 Cash Receivables Inventory Plant assets Accumulated depreciation Long-term investments (held-to-maturity) 2017 $1,780 1,750 1,590 1,940 (1,190) 1,300 $7,170 2016 $1,120 1,300 1,940 1,670 (1,140 ) 1,400 $6,290 Accounts payable Accrued liabilities Bonds payable Common stock Retained earnings $1,220 190 1,380 1,920 2,460 $7,170 $880 250 1,570 1,730 1,860 $6,290 STELLAR COMPANY INCOME STATEMENT FOR...
ES Question 8 Condensed financial data of Sheridan Company for 2017 and 2016 are presented below....
 ES Question 8 Condensed financial data of Sheridan Company for 2017 and 2016 are presented below. SHERIDAN COMPANY COMPARATIVE BALANCE SHEET AS OF DECEMBER 31, 2017 AND 2016 2017 2016 Cash Receivables Inventory Plant assets Accumulated depreciation Long-term investments (held-to-maturity) $1,810 $1,120 1,790 1,330 1,5701,940 1,870 1,740 (1,230) (1,150) 1,300 1,440 $7,110$6,420 $910 260 1,550 1,860 1,740 1,960 $7,110$6,420 Accounts payable Accrued liabilities Bonds payable Common stock Retained earnings $1,220 200 1,370 2,460 SHERIDAN COMPANY INCOME STATEMENT FOR THE YEAR...
Condensed financial data of Wildhorse Company for 2017 and 2016 are presented below. WILDHORSE COMPANY COMPARATIVE...
Condensed financial data of Wildhorse Company for 2017 and 2016 are presented below. WILDHORSE COMPANY COMPARATIVE BALANCE SHEET AS OF DECEMBER 31, 2017 AND 2016 2017 2016 Cash $1,840 $1,170 Receivables 1,730 1,310 Inventory 1,580 1,880 Plant assets 1,910 1,700 Accumulated depreciation (1,210 ) (1,170 ) Long-term investments (held-to-maturity) 1,310 1,420 $7,160 $6,310 Accounts payable $1,190 $900 Accrued liabilities 210 260 Bonds payable 1,400 1,580 Common stock 1,880 1,720 Retained earnings 2,480 1,850 $7,160 $6,310 WILDHORSE COMPANY INCOME STATEMENT FOR...
Condensed financial data of Flint Company for 2017 and 2016 are presented below. FLINT COMPANY COMPARATIVE...
Condensed financial data of Flint Company for 2017 and 2016 are presented below. FLINT COMPANY COMPARATIVE BALANCE SHEET AS OF DECEMBER 31, 2017 AND 2016 2017 2016 Cash $1,790 $1,170 Receivables 1,780 1,310 Inventory 1,580 1,900 Plant assets 1,900 1,720 Accumulated depreciation (1,180 ) (1,140 ) Long-term investments (held-to-maturity) 1,310 1,420 $7,180 $6,380 Accounts payable $1,220 $880 Accrued liabilities 210 240 Bonds payable 1,380 1,550 Common stock 1,930 1,660 Retained earnings 2,440 2,050 $7,180 $6,380 FLINT COMPANY INCOME STATEMENT FOR...
Condensed financial data of Kingbird Company for 2017 and 2016 are presented below KINGBIRD COMPANY COMPARATIVE...
 Condensed financial data of Kingbird Company for 2017 and 2016 are presented below KINGBIRD COMPANY COMPARATIVE BALANCE SHEET AS OF DECEMBER 31, 2017 AND 2016 Cash Receivables Inventory Plant assets Accumulated depreciation Long-term investments (held-to-maturity) 2017 2016 $1,840 $1,170 1,730 1,310 1,580 1,880 1,910 1,700 (1,210) (1,170) 1,310 1,420 $7,160 $6,310 Accounts payable Accrued liabilities Bonds payable Common stock Retained earnings $1,190 $900 260 1,400 1,580 1,880 1,720 2,480 1,850 $7,160 $6,310 210 KINGBIRD COMPANY INCOME STATEMENT FOR THE YEAR...
 Condensed financial data of Blue Company for 2017 and 2016 are
presented below.
Additional information:
During the year, $70 of common stock was issued in exchange for
plant assets. No plant assets were sold in 2017.
Prepare a statement of cash flows using the indirect method.
BLUE COMPANY COMPARATIVE BALANCE SHEET AS OF DECEMBER 31, 2017 AND 2016 2017 2016 Cash $1,780 $1,170 Receivables 1,760 1,280 Inventory 1,620 1,880 Plant assets 1,910 1,670 Accumulated depreciation (1,210) (1,160 ) Long-term investments...
Condensed financial data of Blue Company for 2017 and 2016 are
presented below.
Additional information:
During the year, $70 of common stock was issued in exchange for
plant assets. No plant assets were sold in 2017.
Prepare a statement of cash flows using the indirect method.
BLUE COMPANY COMPARATIVE BALANCE SHEET AS OF DECEMBER 31, 2017 AND 2016 2017 2016 Cash $1,780 $1,170 Receivables 1,760 1,280 Inventory 1,620 1,880 Plant assets 1,910 1,670 Accumulated depreciation (1,210) (1,160 ) Long-term investments...
 Condensed financial data of Oriole Company for 2020 and 2019 are
presented below.
ORIOLE COMPANY COMPARATIVE BALANCE SHEET AS OF DECEMBER 31, 2020 AND 2019 2020 Cash $1,810 Receivables 1,790 Inventory 1,570 Plant assets 1,870 Accumulated depreciation (1,230 ) Long-term investments (held-to-maturity) 1,300 $7,110 2019 $1,120 1,330 1,940 1,740 (1,150 ) 1,440 $6,420 Accounts payable Accrued liabilities Bonds payable Common stock Retained earnings $1,220 200 1,370 1,860 2,460 $7,110 $910 260 1,550 1,740 1,960 $6,420 ORIOLE COMPANY INCOME STATEMENT FOR...
Condensed financial data of Oriole Company for 2020 and 2019 are
presented below.
ORIOLE COMPANY COMPARATIVE BALANCE SHEET AS OF DECEMBER 31, 2020 AND 2019 2020 Cash $1,810 Receivables 1,790 Inventory 1,570 Plant assets 1,870 Accumulated depreciation (1,230 ) Long-term investments (held-to-maturity) 1,300 $7,110 2019 $1,120 1,330 1,940 1,740 (1,150 ) 1,440 $6,420 Accounts payable Accrued liabilities Bonds payable Common stock Retained earnings $1,220 200 1,370 1,860 2,460 $7,110 $910 260 1,550 1,740 1,960 $6,420 ORIOLE COMPANY INCOME STATEMENT FOR...
 Condensed financial data of Swifty Company for 2017 and 2016 are presented below. SWIFTY COMPANY COMPARATIVE BALANCE SHEET AS OF DECEMBER 31,2017 AND 2016 2017 2016 1.840 $1,170 Cash 1,730 1,310 Receivables 1,580 1,880 Inventory ,910 1,700 Plant assets 1.210) (1,170) Accumulated depreciation Long-term investments (held-to-maturity) 1.310 1420 $7,160 $6,310 Accounts payable $1.190 $900 210 Accrued liabilities 260 Bonds payable 1400 1,580 Common stock 1,880 1,720 2,480 1,850 Retained earnings $7,160 $6,310 SWIFTY COMPANY INCOME STATEMENT FOR THE YEAR ENDED...
 Condensed financial data of Teal Company for 2020 and 2019 are presented below. TEAL COMPANY COMPARATIVE BALANCE SHEET AS OF DECEMBER 31, 2020 AND 2019 2020 2019 Cash $1,830 $1,180 Receivables 1.710 1,320 Inventory 1,590 1,920 Plant assets 1,890 1.710 Accumulated depreciation (1.220) (1.190) Long-term investments (held-to-maturity] 1,320 1.440 $7.120 $6,380 $1,190 $890 210 260 Accounts payable Accrued liabilities Bonds payable Common stock Retained earnings 1,400 1,580 1.940 1,660 2.380 1.990 $7.120 $6,380 TEAL COMPANY INCOME STATEMENT FOR THE YEAR...
 Exercise 23-12 Condensed financial data of Stellar Company for 2017 and 2016 are present STELLAR COMPANY COMPARATIVE BALANCE SHEET AS OF DECEMBER 31, 2017 AND 2016 Cash Receivables Inventory Plant assets Accumulated depreciation Long-term investments (held-to-maturity) 2017 $1,780 1,750 1,590 1,940 (1,190) 1,300 $7,170 2016 $1,120 1,300 1,940 1,670 (1,140 ) 1,400 $6,290 Accounts payable Accrued liabilities Bonds payable Common stock Retained earnings $1,220 190 1,380 1,920 2,460 $7,170 $880 250 1,570 1,730 1,860 $6,290 STELLAR COMPANY INCOME STATEMENT FOR...
 ES Question 8 Condensed financial data of Sheridan Company for 2017 and 2016 are presented below. SHERIDAN COMPANY COMPARATIVE BALANCE SHEET AS OF DECEMBER 31, 2017 AND 2016 2017 2016 Cash Receivables Inventory Plant assets Accumulated depreciation Long-term investments (held-to-maturity) $1,810 $1,120 1,790 1,330 1,5701,940 1,870 1,740 (1,230) (1,150) 1,300 1,440 $7,110$6,420 $910 260 1,550 1,860 1,740 1,960 $7,110$6,420 Accounts payable Accrued liabilities Bonds payable Common stock Retained earnings $1,220 200 1,370 2,460 SHERIDAN COMPANY INCOME STATEMENT FOR THE YEAR...
 Condensed financial data of Kingbird Company for 2017 and 2016 are presented below KINGBIRD COMPANY COMPARATIVE BALANCE SHEET AS OF DECEMBER 31, 2017 AND 2016 Cash Receivables Inventory Plant assets Accumulated depreciation Long-term investments (held-to-maturity) 2017 2016 $1,840 $1,170 1,730 1,310 1,580 1,880 1,910 1,700 (1,210) (1,170) 1,310 1,420 $7,160 $6,310 Accounts payable Accrued liabilities Bonds payable Common stock Retained earnings $1,190 $900 260 1,400 1,580 1,880 1,720 2,480 1,850 $7,160 $6,310 210 KINGBIRD COMPANY INCOME STATEMENT FOR THE YEAR...
Most questions answered within 3 hours.
-
Where is the error in this code sequence?
String s1 = "Hello";
String s2 = "ello";...
asked 11 months ago -
Financial data for Joel de Paris, Inc., for last year
follow:
Joel de Paris, Inc.
Balance...
asked 11 months ago -
Consider this reaction:
Al2(SO4)3 (aq)+ BaCl3
(aq) Al2Cl6 (aq)- +
3BaSO4(s) . What is the...
asked 11 months ago -
Suppose that Savneet is considering increasing her
recent random sample from 20 car rentals to 40...
asked 11 months ago -
Trucks arrive at an unloading terminal at an average rate of 120
per hour.
Trucks arrive...
asked 11 months ago -
Why are methanol and ethanol completely soluble in water while
octanol is not very little soluble....
asked 11 months ago -
A facilities manager at a university reads in a research report
that the mean amount of...
asked 11 months ago -
When the CuSO4 is rehydrated by adding water to the anhydrous
compound, is this an endothermic...
asked 11 months ago -
A ray of sunlight is passing from diamond into crown glass; the
angle of incidence is...
asked 11 months ago -
A block of mass 0.249 kg is placed on top of a light, vertical
spring of...
asked 11 months ago -
how do the kidneys compensate in the presences of acidosis
a) trigger hyperventilate
b) reserve acid...
asked 11 months ago -
Question 501 pts
The rental rate of capital to the firm increases. Which of the
following...
asked 11 months ago