Solve all parts and show working:
(i) :
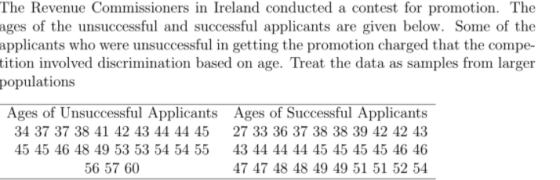
Use a 5% significance level to test the claim that the unsuccessful applicants are from a population with a greater mean age than the mean age of successful applicants. Based on the result, does there appear to be discrimination based on age? What did you use to get the answer?
(ii): Is it a parametric or non-parametric test? If it is a parametric test what is distribution of test statistic
Homework Answers
Request Answer!
We need at least 10 more requests to produce the answer.
0 / 10 have requested this problem solution
The more requests, the faster the answer.
Add Answer to:
Solve all parts and show working:
(i) :
Use a 5% significance level to test the...
Do the Academy Awards involve discrimination based on age? Listed below are the ages of actresses...
Do the Academy Awards involve discrimination based on age? Listed below are the ages of actresses and actors at the times that they won Oscars in the Best Actress and Best Actor categories. the ages are listed in order, beginning with the first Academy Awards ceremony in 1928. (Note: in 1968 there was a tie in the Best Actress category, and the mean of the two ages is used; in 1932 there was a tie in the Best Actor category,...
Use the 65 scores in table 3.1 and develop grades based on 20% A, 30% B,...
 Use the 65 scores in table 3.1 and develop grades based on 20%
A, 30% B, 40% C, and 10% D. You might find figure 3.1 helpful as
you complete this assignment. What are the cutoff scores for the
various grades?
Table 3.1 48 49 65 VO,max Values 45 50 51 51 48 43 48 41 53 48 45 46 50 51 47 48 47 46 49 49 44 49 45 48 51 48 52 47 44 47 51 46...
Use the 65 scores in table 3.1 and develop grades based on 20%
A, 30% B, 40% C, and 10% D. You might find figure 3.1 helpful as
you complete this assignment. What are the cutoff scores for the
various grades?
Table 3.1 48 49 65 VO,max Values 45 50 51 51 48 43 48 41 53 48 45 46 50 51 47 48 47 46 49 49 44 49 45 48 51 48 52 47 44 47 51 46...
NUMBER OF PEOPLE 10.2 10.0 10.1 8.5 10.2 8.2 8 Source: United States Census. 11. In...
 NUMBER OF PEOPLE 10.2 10.0 10.1 8.5 10.2 8.2 8 Source: United States Census. 11. In the Sanitary District of Chicago, operating engineers are hired on of a competitive civil-service examination. In 1966, there were 223 appl for 15 jobs. The exam was held on March 12; the test scores are s arranged in increasing order. The height of each bar in the histogram next page) shows the number of people with the correspondin examiners were charged with rigging the...
estimate the average age at which multiple sclerosis patients were diagnosed with the condition for the...
estimate the average age at which multiple sclerosis patients were diagnosed with the condition for the first time in a given city. How big should the sample be? Define your procedures for this estimate (if necessary, set your own values of unknown parameters, based on statistical theory). In Table 1 you will find all ages of this patient population. 54 58 56 48 62 59 55 56 60 52 53 61 56 56 53 37 71 62 39 61 54...
Inferences from Two Samples chapter Listed below are the ages of actresses the awards ceremony, b...
 Inferences from Two Samples chapter Listed below are the ages of actresses the awards ceremony, but the ages in and actors at the times that they won the table below are based on the birth Oscars for the categories of Best Actress date of the winner and the date of the and Best Actor. The ages aze listed in awards certmony) chronological otder by row, so that cor- responding locations in the two tables Analyzing the Results are from the...
The accompanying computer excel output (please see attachment on Blackboard) provides details of data and analysis...
 The accompanying computer excel output
(please see attachment on Blackboard) provides details of data and
analysis on the topic of “patient satisfaction”. A hospital
administrator wished to study the relation between patient
satisfaction (Y) and patients’ age (X1, in years) , severity of
illness (X2), and anxiety level (X3).
The output includes a listing of all
46 observations; descriptive statistics for each variable; and, the
results of a regression analysis that uses patient satisfaction as
the dependent variable, and patient’s...
The accompanying computer excel output
(please see attachment on Blackboard) provides details of data and
analysis on the topic of “patient satisfaction”. A hospital
administrator wished to study the relation between patient
satisfaction (Y) and patients’ age (X1, in years) , severity of
illness (X2), and anxiety level (X3).
The output includes a listing of all
46 observations; descriptive statistics for each variable; and, the
results of a regression analysis that uses patient satisfaction as
the dependent variable, and patient’s...
These are my instructions: Your data should have been read in from the data file and stored into ...
These are my instructions: Your data should have been read in from the data file and stored into an array. Next you need to calculate the following and display in a single Message box: Average score Highest score Lowest score Mode of the scores Your program should be written using methods and should be well documented internally and externally. Your output should be displayed using Message boxes. This is the .text file to use with the instructions: 20 21 22...
3. A hospital administrator wished to study the relation between patient satisfaction (Y) and pat...
 solvel only E F G H
below is pat data
3. A hospital administrator wished to study the relation between patient satisfaction (Y) and patients age (Xi, in years), severity of illness (X2, an index) and anxiety level (X3, an index). The administrator randomly selected 23 patients and collected the data in pat, where larger values of Y, X2 and X3 are, respectively, associated with more satisfaction, increased severity of illness and more anxiety. The data is saved in Moodle2...
solvel only E F G H
below is pat data
3. A hospital administrator wished to study the relation between patient satisfaction (Y) and patients age (Xi, in years), severity of illness (X2, an index) and anxiety level (X3, an index). The administrator randomly selected 23 patients and collected the data in pat, where larger values of Y, X2 and X3 are, respectively, associated with more satisfaction, increased severity of illness and more anxiety. The data is saved in Moodle2...
twenty eight 34 34 34 35 36 37 38 38 42 44 44 45 46 47...
twenty eight 34 34 34 35 36 37 38 38 42 44 44 45 46 47 47 48 48 51 53 54 54 57 58 58 59 59 61 62 62 63 63 64 64 64 66 What is the percentile of thirtyeight
37 38 39 Question 51 (1 point) Below are shown three structures for Carvone, a substance...
 37 38 39 Question 51 (1 point) Below are shown three structures for Carvone, a substance responsible for the odor of spearmint. Which one of the structures is a line structure? 40 41 42 HH CHH CH2 43 44 45 C-CC-CC-0 CH HC Hн. 46 47 48 (C-H "CH₂ H1 HHH B 49 50 51 Carvone 52 53 54 ✓ 55 56 B ✓ None of the above
 Use the 65 scores in table 3.1 and develop grades based on 20%
A, 30% B, 40% C, and 10% D. You might find figure 3.1 helpful as
you complete this assignment. What are the cutoff scores for the
various grades?
Table 3.1 48 49 65 VO,max Values 45 50 51 51 48 43 48 41 53 48 45 46 50 51 47 48 47 46 49 49 44 49 45 48 51 48 52 47 44 47 51 46...
Use the 65 scores in table 3.1 and develop grades based on 20%
A, 30% B, 40% C, and 10% D. You might find figure 3.1 helpful as
you complete this assignment. What are the cutoff scores for the
various grades?
Table 3.1 48 49 65 VO,max Values 45 50 51 51 48 43 48 41 53 48 45 46 50 51 47 48 47 46 49 49 44 49 45 48 51 48 52 47 44 47 51 46...
 NUMBER OF PEOPLE 10.2 10.0 10.1 8.5 10.2 8.2 8 Source: United States Census. 11. In the Sanitary District of Chicago, operating engineers are hired on of a competitive civil-service examination. In 1966, there were 223 appl for 15 jobs. The exam was held on March 12; the test scores are s arranged in increasing order. The height of each bar in the histogram next page) shows the number of people with the correspondin examiners were charged with rigging the...
 Inferences from Two Samples chapter Listed below are the ages of actresses the awards ceremony, but the ages in and actors at the times that they won the table below are based on the birth Oscars for the categories of Best Actress date of the winner and the date of the and Best Actor. The ages aze listed in awards certmony) chronological otder by row, so that cor- responding locations in the two tables Analyzing the Results are from the...
 The accompanying computer excel output
(please see attachment on Blackboard) provides details of data and
analysis on the topic of “patient satisfaction”. A hospital
administrator wished to study the relation between patient
satisfaction (Y) and patients’ age (X1, in years) , severity of
illness (X2), and anxiety level (X3).
The output includes a listing of all
46 observations; descriptive statistics for each variable; and, the
results of a regression analysis that uses patient satisfaction as
the dependent variable, and patient’s...
The accompanying computer excel output
(please see attachment on Blackboard) provides details of data and
analysis on the topic of “patient satisfaction”. A hospital
administrator wished to study the relation between patient
satisfaction (Y) and patients’ age (X1, in years) , severity of
illness (X2), and anxiety level (X3).
The output includes a listing of all
46 observations; descriptive statistics for each variable; and, the
results of a regression analysis that uses patient satisfaction as
the dependent variable, and patient’s...
 solvel only E F G H
below is pat data
3. A hospital administrator wished to study the relation between patient satisfaction (Y) and patients age (Xi, in years), severity of illness (X2, an index) and anxiety level (X3, an index). The administrator randomly selected 23 patients and collected the data in pat, where larger values of Y, X2 and X3 are, respectively, associated with more satisfaction, increased severity of illness and more anxiety. The data is saved in Moodle2...
solvel only E F G H
below is pat data
3. A hospital administrator wished to study the relation between patient satisfaction (Y) and patients age (Xi, in years), severity of illness (X2, an index) and anxiety level (X3, an index). The administrator randomly selected 23 patients and collected the data in pat, where larger values of Y, X2 and X3 are, respectively, associated with more satisfaction, increased severity of illness and more anxiety. The data is saved in Moodle2...
 37 38 39 Question 51 (1 point) Below are shown three structures for Carvone, a substance responsible for the odor of spearmint. Which one of the structures is a line structure? 40 41 42 HH CHH CH2 43 44 45 C-CC-CC-0 CH HC Hн. 46 47 48 (C-H "CH₂ H1 HHH B 49 50 51 Carvone 52 53 54 ✓ 55 56 B ✓ None of the above
Most questions answered within 3 hours.
-
Where is the error in this code sequence?
String s1 = "Hello";
String s2 = "ello";...
asked 10 months ago -
Financial data for Joel de Paris, Inc., for last year
follow:
Joel de Paris, Inc.
Balance...
asked 10 months ago -
Consider this reaction:
Al2(SO4)3 (aq)+ BaCl3
(aq) Al2Cl6 (aq)- +
3BaSO4(s) . What is the...
asked 10 months ago -
Suppose that Savneet is considering increasing her
recent random sample from 20 car rentals to 40...
asked 10 months ago -
Trucks arrive at an unloading terminal at an average rate of 120
per hour.
Trucks arrive...
asked 10 months ago -
Why are methanol and ethanol completely soluble in water while
octanol is not very little soluble....
asked 10 months ago -
A facilities manager at a university reads in a research report
that the mean amount of...
asked 10 months ago -
When the CuSO4 is rehydrated by adding water to the anhydrous
compound, is this an endothermic...
asked 10 months ago -
A ray of sunlight is passing from diamond into crown glass; the
angle of incidence is...
asked 10 months ago -
A block of mass 0.249 kg is placed on top of a light, vertical
spring of...
asked 10 months ago -
how do the kidneys compensate in the presences of acidosis
a) trigger hyperventilate
b) reserve acid...
asked 10 months ago -
Question 501 pts
The rental rate of capital to the firm increases. Which of the
following...
asked 10 months ago