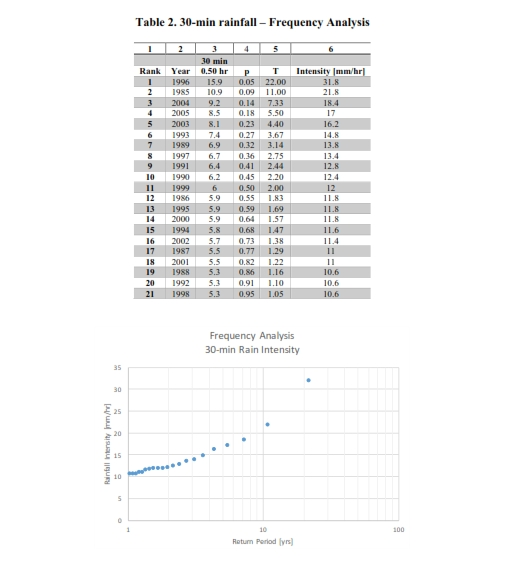
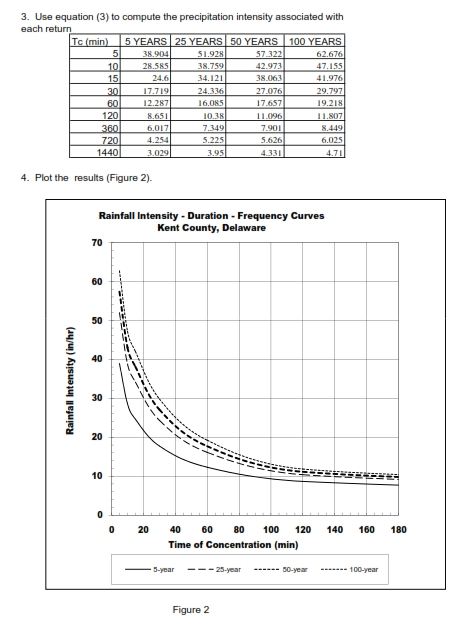
Using the data available about rainfall extreme depths at different durations, develop IDF curves for 5,...
Using the data available about rainfall extreme depths at different durations, develop IDF curves for 5, 25, 50- and 100-year return periods.
Homework Answers


Add Answer to:
Using the data available about rainfall extreme depths at
different durations, develop IDF curves for 5,...
15.Development of IDF curve. A 20-year annual maximum series of 15 min, 30 min, min and...
 15.Development of IDF curve. A 20-year annual maximum series of 15 min, 30 min, min and 120 min storm depths are given in the table below. Determine the average intensities associated with return periods of 5, 10, 25, 50 and 100 years. Assume that extreme value type 1 Gumbel distribution fits the given rainfall series. Plot the curves! Use Excel. (Precipitation (depth) in INCHES) Precipitation (depth) Precipitation (depth) Precipitation (depth) Precipitation (depth) 60 minutes 120 minutes 15 minutes 30 minutes...
2.9 Storm data (Fig. P2-9) were recorded for a storm over a 205-acre basin on Sep- 9 tember 1, 1999. Approximations for the rainfall and runoff cumulative mass curves are shown by the black dashes in...
 2.9 Storm data (Fig. P2-9) were recorded for a storm over a 205-acre basin on Sep- 9 tember 1, 1999. Approximations for the rainfall and runoff cumulative mass curves are shown by the black dashes in the figure. (a) Determine the duration and average intensity of the rainfall (b) What is the time to peak for this storm? (c) Find the φ index for this storm using the rainfall and hydrograph data. (d) Develop a UH for this watershed using...
Storm data were collected for a 810-acre basin. Approximations for the wadi-flow, rainfall and runoff cumulative...
 Storm data were collected for a 810-acre basin. Approximations for the wadi-flow, rainfall and runoff cumulative mass curves are shown in the following figure. 5.00 500 485 4.75 450 445 4.50 4.25 4.00 425 Cumulated DRO -Cumulated gross rainfall Wadi-flow 400 3.75 3.50 350 3.25 315 3.00 295 300 2.75 Cumulated Gross rainfall and DRO in inches 2.50 250 Wadi flow (cfs) 2.25 215 2.00 200 1.75 1.50 155 150 140 1.25 1.00 100 90 0.75 75 0.50 55 50...
(15 marks) 26. For the annual maximum series of 15 min, 30 min, storm depths given...
 (15 marks) 26. For the annual maximum series of 15 min, 30 min, storm depths given in the table below, Determine the average intensities associate with return periods of 5, 10, 25, 50, and 100 years. Assume that extreme value type I Gumbel distribution fits the given rainfall series. Do Not Plot them. Just proved the values. (P = Pmean + Ko) 11 3.321 3.088 Table 2.2. Frequency Factor K for Extreme Value Type Distribution T: (years) 5 10 25...
The Weather Service Bureau department has data representing monthly rainfall for a year and we would...
The Weather Service Bureau department has data representing monthly rainfall for a year and we would like to create a table categorizing each month as rainy (rainfall 20% higher than average) dry (rainfall 25% lower than average) or average. The data file for monthly rain fall is called rainfall.txt. rainfall.txt 95 100 120 130 135 145 155 185 190 160 130 120 Store the data file in the same folder (lab 6) of your lab6.cpp. OutputThe year's average monthly rainfall...
Calculate the following forecasts using the data below. For periods 4 through 10, develop the exponentially...
Calculate the following forecasts using the data below. For periods 4 through 10, develop the exponentially smoothed forecasts using a forecast for period 3 (F3) of 45.0 and an alpha of 0.4. Calculate the three-period moving-average forecast for periods 4 through 10. Calculate the weighted moving average for periods 4 through 10, using weights of .70, .20, and .10, with 0.70 applied to the most recent data Calculate the mean absolute deviation (MAD) for each forecasting procedure. Which forecasting procedure...
Below is a generic pie chart and bar chart presenting the same data about six different...
 Below is a generic pie chart and bar chart presenting the same data about six different groups. A 27% 5 27% B 23% C 229, D 16% 23 E 6% F 5% 雖c OA OB OD OE 0 25 50 75 100 (Photo courtesy of slideshare.net) When comparing pie and bar charts displayed above, which of the following statements are valid statements? More than one choice may be selected. The number line in the bar chart is divided into percentages....
(1) Using your textbook, name three different methods for collecting kinematic data. Complete the table below:...
 (1) Using your textbook, name three different methods for collecting kinematic data. Complete the table below: Data Collection Method How the method Advantage of works Disadvantage of method method 3 (2) For the graphs of (i) plantar flex/ext, (ii) knee flex/ext, (iii hip flex/ext, and (iv) hip ab/adduction below, provide the following information: 30 Dors a. Describe the motion of the segment. b. When during the gait cycle is it happening? (At what stages of the cycle?) 70 c. Why...
Select a product market that is of interest to you. Use what you know about this...
 Select a product market that is of interest to you. Use what you know about this industry and knowledge from this course to answer the questions below. 1. a. Explain what you believe is the elasticity of demand in this market. Is it elastic or inelastic? Explain why? b. Provide an estimate of price and quantity sold in a recent period for this industry based on available data or estimates. Use whatever parameters are available (i.e. for a recent year...
EXP. 5 BUFFERS, TITRATION CURVES, AND INDICATORS STUDENT COPY DATA SHEET RECORD YOUR DATA HERE AS...
 EXP. 5 BUFFERS, TITRATION CURVES, AND INDICATORS STUDENT COPY DATA SHEET RECORD YOUR DATA HERE AS YOU DO THE EXPERIMENT You must record measurements to the correct number of decimal places, and with the appropriate units, for each piece of equipment used. Name of Partner: Not applicable Concentration of stock NaOH (from Exp. 3 Brown Bottle): 0.1135 M Part 1 - Titration Curves Make sure all pH readings have the appropriate number of decimal points pH of acetic acid: 3.29...
 15.Development of IDF curve. A 20-year annual maximum series of 15 min, 30 min, min and 120 min storm depths are given in the table below. Determine the average intensities associated with return periods of 5, 10, 25, 50 and 100 years. Assume that extreme value type 1 Gumbel distribution fits the given rainfall series. Plot the curves! Use Excel. (Precipitation (depth) in INCHES) Precipitation (depth) Precipitation (depth) Precipitation (depth) Precipitation (depth) 60 minutes 120 minutes 15 minutes 30 minutes...
 2.9 Storm data (Fig. P2-9) were recorded for a storm over a 205-acre basin on Sep- 9 tember 1, 1999. Approximations for the rainfall and runoff cumulative mass curves are shown by the black dashes in the figure. (a) Determine the duration and average intensity of the rainfall (b) What is the time to peak for this storm? (c) Find the φ index for this storm using the rainfall and hydrograph data. (d) Develop a UH for this watershed using...
 Storm data were collected for a 810-acre basin. Approximations for the wadi-flow, rainfall and runoff cumulative mass curves are shown in the following figure. 5.00 500 485 4.75 450 445 4.50 4.25 4.00 425 Cumulated DRO -Cumulated gross rainfall Wadi-flow 400 3.75 3.50 350 3.25 315 3.00 295 300 2.75 Cumulated Gross rainfall and DRO in inches 2.50 250 Wadi flow (cfs) 2.25 215 2.00 200 1.75 1.50 155 150 140 1.25 1.00 100 90 0.75 75 0.50 55 50...
 (15 marks) 26. For the annual maximum series of 15 min, 30 min, storm depths given in the table below, Determine the average intensities associate with return periods of 5, 10, 25, 50, and 100 years. Assume that extreme value type I Gumbel distribution fits the given rainfall series. Do Not Plot them. Just proved the values. (P = Pmean + Ko) 11 3.321 3.088 Table 2.2. Frequency Factor K for Extreme Value Type Distribution T: (years) 5 10 25...
 Below is a generic pie chart and bar chart presenting the same data about six different groups. A 27% 5 27% B 23% C 229, D 16% 23 E 6% F 5% 雖c OA OB OD OE 0 25 50 75 100 (Photo courtesy of slideshare.net) When comparing pie and bar charts displayed above, which of the following statements are valid statements? More than one choice may be selected. The number line in the bar chart is divided into percentages....
 (1) Using your textbook, name three different methods for collecting kinematic data. Complete the table below: Data Collection Method How the method Advantage of works Disadvantage of method method 3 (2) For the graphs of (i) plantar flex/ext, (ii) knee flex/ext, (iii hip flex/ext, and (iv) hip ab/adduction below, provide the following information: 30 Dors a. Describe the motion of the segment. b. When during the gait cycle is it happening? (At what stages of the cycle?) 70 c. Why...
 Select a product market that is of interest to you. Use what you know about this industry and knowledge from this course to answer the questions below. 1. a. Explain what you believe is the elasticity of demand in this market. Is it elastic or inelastic? Explain why? b. Provide an estimate of price and quantity sold in a recent period for this industry based on available data or estimates. Use whatever parameters are available (i.e. for a recent year...
 EXP. 5 BUFFERS, TITRATION CURVES, AND INDICATORS STUDENT COPY DATA SHEET RECORD YOUR DATA HERE AS YOU DO THE EXPERIMENT You must record measurements to the correct number of decimal places, and with the appropriate units, for each piece of equipment used. Name of Partner: Not applicable Concentration of stock NaOH (from Exp. 3 Brown Bottle): 0.1135 M Part 1 - Titration Curves Make sure all pH readings have the appropriate number of decimal points pH of acetic acid: 3.29...
Most questions answered within 3 hours.
-
Where is the error in this code sequence?
String s1 = "Hello";
String s2 = "ello";...
asked 10 months ago -
Financial data for Joel de Paris, Inc., for last year
follow:
Joel de Paris, Inc.
Balance...
asked 10 months ago -
Consider this reaction:
Al2(SO4)3 (aq)+ BaCl3
(aq) Al2Cl6 (aq)- +
3BaSO4(s) . What is the...
asked 10 months ago -
Suppose that Savneet is considering increasing her
recent random sample from 20 car rentals to 40...
asked 10 months ago -
Trucks arrive at an unloading terminal at an average rate of 120
per hour.
Trucks arrive...
asked 10 months ago -
Why are methanol and ethanol completely soluble in water while
octanol is not very little soluble....
asked 10 months ago -
A facilities manager at a university reads in a research report
that the mean amount of...
asked 10 months ago -
When the CuSO4 is rehydrated by adding water to the anhydrous
compound, is this an endothermic...
asked 10 months ago -
A ray of sunlight is passing from diamond into crown glass; the
angle of incidence is...
asked 10 months ago -
A block of mass 0.249 kg is placed on top of a light, vertical
spring of...
asked 10 months ago -
how do the kidneys compensate in the presences of acidosis
a) trigger hyperventilate
b) reserve acid...
asked 10 months ago -
Question 501 pts
The rental rate of capital to the firm increases. Which of the
following...
asked 10 months ago