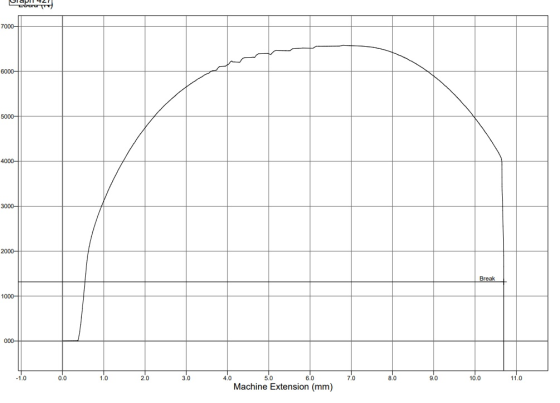
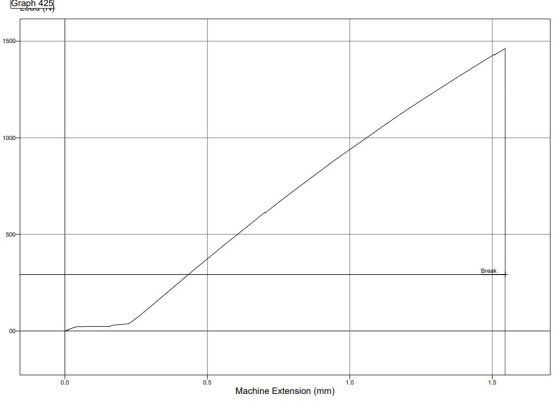
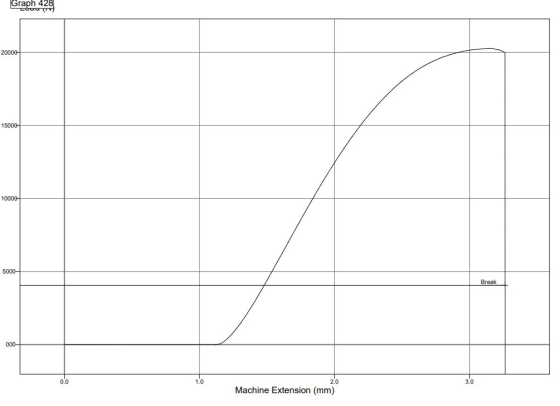
These graphs are stress vs strain curves for each metal and polymer samples. Label the graphs where the material showed UTS, yield stress and beraking strain.


Homework Answers


Add Answer to:
These graphs are stress vs strain curves for each metal and
polymer samples. Label the graphs...
Below are four bivariate data sets and the scatter plot for each. (Note that each scatter...
Below are four bivariate data sets and the scatter plot for each. (Note that each scatter plot is displayed on the same scale.) Each data set is made up of sample values drawn from a population. x y 1.0 4.1 2.0 6.1 3.0 7.0 4.0 4.0 5.0 5.2 6.0 8.1 7.0 5.5 8.0 6.9 9.0 9.0 10.0 7.3 x1234567891011y12345678910110 Figure 1 u v 1.0 8.1 2.0 7.4 3.0 8.1 4.0 6.1 5.0 7.4 6.0 4.5 7.0 4.6 8.0 3.4...
analyze this NMR & IR S23 CDC13 QE-300 240 UN (43 MIL.) 10.02s, 1H), 7.716.J-2 Hz....
 analyze this NMR & IR
S23 CDC13 QE-300 240 UN (43 MIL.) 10.02s, 1H), 7.716.J-2 Hz. ) 2.0 11.5 11.0 10.5 10.0 9.5 9.0 8.5 8.0 7.5 7.0 6.5 6.0 4.0 3.5 3.0 2.5 20 15 100.5 0.0 -0.5 -1.0 -1.5 -2. 5.5 5.0 4.5 fl (ppm)
analyze this NMR & IR
S23 CDC13 QE-300 240 UN (43 MIL.) 10.02s, 1H), 7.716.J-2 Hz. ) 2.0 11.5 11.0 10.5 10.0 9.5 9.0 8.5 8.0 7.5 7.0 6.5 6.0 4.0 3.5 3.0 2.5 20 15 100.5 0.0 -0.5 -1.0 -1.5 -2. 5.5 5.0 4.5 fl (ppm)
Boxes Task: Evaluate whether you can load various sizes of jars into boxes. For each test,...
Boxes Task: Evaluate whether you can load various sizes of jars into boxes. For each test, you will input the length, width, and height of a box as well as the diameter and height of a cylindrical jar. The algorithm will determine whether each jar will fit in its corresponding box. The jar can sit upright in the box, or it can lie on its side with its top parallel to one of the sides of the box. Assume that...
7. What kind of carbons correspond to these chemical shifts? 8. Based on this analysis, the unknown might contain the f...
 7. What kind of carbons correspond to these chemical
shifts?
8. Based on this analysis, the unknown might contain the
following substructure:
UN (43 MIL.) 10.02s, 1H), 7.716.J-2 Hz. ) 2.0 11.5 11.0 10.5 10.0 9.5 9.0 8.5 8.0 7.5 7.0 6.5 6.0 4.0 3.5 3.0 2.5 20 15 100.5 0.0 -0.5 -1.0 -1.5 -2. 5.5 5.0 4.5 fl (ppm)
7. What kind of carbons correspond to these chemical
shifts?
8. Based on this analysis, the unknown might contain the
following substructure:
UN (43 MIL.) 10.02s, 1H), 7.716.J-2 Hz. ) 2.0 11.5 11.0 10.5 10.0 9.5 9.0 8.5 8.0 7.5 7.0 6.5 6.0 4.0 3.5 3.0 2.5 20 15 100.5 0.0 -0.5 -1.0 -1.5 -2. 5.5 5.0 4.5 fl (ppm)
Hi it's my code for python I almost finished my project but only one thing left which is most con...
 Hi it's my code for python
I almost finished my project but only one thing left which is
most confusing part please help me
I have to find most occurring ending character from a to z
For instance, output should be like this I have to find a to
z.
Words starting with ‘a’ end mostly with ‘O’
Words starting with ‘b’ end mostly with ‘O’
......
No words start with ‘O’(If there's no word in the character from a...
Hi it's my code for python
I almost finished my project but only one thing left which is
most confusing part please help me
I have to find most occurring ending character from a to z
For instance, output should be like this I have to find a to
z.
Words starting with ‘a’ end mostly with ‘O’
Words starting with ‘b’ end mostly with ‘O’
......
No words start with ‘O’(If there's no word in the character from a...
I really need help answering these questions please. I believe the concentration value is the bottom...
 I
really need help answering these questions please. I believe the
concentration value is the bottom table.
DATA TABLE. PART 1 Temperature,°C Reaction time, s 10 37 27.8 93.Ce Le 83 35 93 lo .5 DATA TABLE. PART 2 Volume of Volume of Volume of Reaction time, s A, mL B, mL water, mL 10.0 10.0 10.0 10.0 10.0 10.0 10.0 10.0 10.0 10.0 9.0 8.0 7.0 6.0 5.0 4.0 3.0 2.0 0.0 1.0 2.0 3.0 4.0 5.0 6.0 7.0...
I
really need help answering these questions please. I believe the
concentration value is the bottom table.
DATA TABLE. PART 1 Temperature,°C Reaction time, s 10 37 27.8 93.Ce Le 83 35 93 lo .5 DATA TABLE. PART 2 Volume of Volume of Volume of Reaction time, s A, mL B, mL water, mL 10.0 10.0 10.0 10.0 10.0 10.0 10.0 10.0 10.0 10.0 9.0 8.0 7.0 6.0 5.0 4.0 3.0 2.0 0.0 1.0 2.0 3.0 4.0 5.0 6.0 7.0...
5. Based on this analysis, the compound might be or contain the following substructure: 6. How...
 5. Based on this analysis, the compound might be or contain
the following substructure:
6. How many different types of carbons appear to be present?
What are the chemical shifts for these carbons?
UN (43 MIL.) 10.02s, 1H), 7.716.J-2 Hz. ) 2.0 11.5 11.0 10.5 10.0 9.5 9.0 8.5 8.0 7.5 7.0 6.5 6.0 4.0 3.5 3.0 2.5 20 15 100.5 0.0 -0.5 -1.0 -1.5 -2. 5.5 5.0 4.5 fl (ppm)
5. Based on this analysis, the compound might be or contain
the following substructure:
6. How many different types of carbons appear to be present?
What are the chemical shifts for these carbons?
UN (43 MIL.) 10.02s, 1H), 7.716.J-2 Hz. ) 2.0 11.5 11.0 10.5 10.0 9.5 9.0 8.5 8.0 7.5 7.0 6.5 6.0 4.0 3.5 3.0 2.5 20 15 100.5 0.0 -0.5 -1.0 -1.5 -2. 5.5 5.0 4.5 fl (ppm)
Below are four bivariate data sets and the scatter plot for each. (Note that each scatter...
 Below are four bivariate data sets and the scatter plot for each. (Note that each scatter plot is displayed on the same scale.) Each data set is made up of sample values drawn from a population. y 1.0 7.4 2.0 9.0 3.0 7.0 11 10- 11 102 9 8+ 7+ 8+ 71 61 5 5 41 4.0 5.4 5.0 7.5 6.05.2 7.0 4.5 8.0 7.1 9.0 5.5 10.0 3.9 V 1.0 8.0 2.0 6.9 3.07.3 4.0 6.1 5.0 7.4 6.0...
The motion of a particle is described in the velocity vs. time graph shown in the...
 The motion of a particle is described in the velocity vs. time graph shown in the figure. v (m/s) 5.0 4.0 3.0 2.0 1.0 2.02.0 4.0 5.0 6.0 7.0 8.0 9.0 2.0 3.0 4.0 For what time interval does the particle's direction of motion change a. Between 1 and 3 s b. Between 3 and 4 s c. Between 4 and 9 s d. Between 8 and 9 s e. the particle's direction of motion does not change at all
3. Based on the integration of the peaks, what is the relative number of protons which...
 3. Based on the integration of the peaks, what is the relative
number of protons which make up each signal?
4. Identify any common splitting patterns. (ie. Isopropyl,
ethyl, etc)
UN (43 MIL.) 10.02s, 1H), 7.716.J-2 Hz. ) 2.0 11.5 11.0 10.5 10.0 9.5 9.0 8.5 8.0 7.5 7.0 6.5 6.0 4.0 3.5 3.0 2.5 20 15 100.5 0.0 -0.5 -1.0 -1.5 -2. 5.5 5.0 4.5 fl (ppm)
3. Based on the integration of the peaks, what is the relative
number of protons which make up each signal?
4. Identify any common splitting patterns. (ie. Isopropyl,
ethyl, etc)
UN (43 MIL.) 10.02s, 1H), 7.716.J-2 Hz. ) 2.0 11.5 11.0 10.5 10.0 9.5 9.0 8.5 8.0 7.5 7.0 6.5 6.0 4.0 3.5 3.0 2.5 20 15 100.5 0.0 -0.5 -1.0 -1.5 -2. 5.5 5.0 4.5 fl (ppm)
 analyze this NMR & IR
S23 CDC13 QE-300 240 UN (43 MIL.) 10.02s, 1H), 7.716.J-2 Hz. ) 2.0 11.5 11.0 10.5 10.0 9.5 9.0 8.5 8.0 7.5 7.0 6.5 6.0 4.0 3.5 3.0 2.5 20 15 100.5 0.0 -0.5 -1.0 -1.5 -2. 5.5 5.0 4.5 fl (ppm)
analyze this NMR & IR
S23 CDC13 QE-300 240 UN (43 MIL.) 10.02s, 1H), 7.716.J-2 Hz. ) 2.0 11.5 11.0 10.5 10.0 9.5 9.0 8.5 8.0 7.5 7.0 6.5 6.0 4.0 3.5 3.0 2.5 20 15 100.5 0.0 -0.5 -1.0 -1.5 -2. 5.5 5.0 4.5 fl (ppm)
 7. What kind of carbons correspond to these chemical
shifts?
8. Based on this analysis, the unknown might contain the
following substructure:
UN (43 MIL.) 10.02s, 1H), 7.716.J-2 Hz. ) 2.0 11.5 11.0 10.5 10.0 9.5 9.0 8.5 8.0 7.5 7.0 6.5 6.0 4.0 3.5 3.0 2.5 20 15 100.5 0.0 -0.5 -1.0 -1.5 -2. 5.5 5.0 4.5 fl (ppm)
7. What kind of carbons correspond to these chemical
shifts?
8. Based on this analysis, the unknown might contain the
following substructure:
UN (43 MIL.) 10.02s, 1H), 7.716.J-2 Hz. ) 2.0 11.5 11.0 10.5 10.0 9.5 9.0 8.5 8.0 7.5 7.0 6.5 6.0 4.0 3.5 3.0 2.5 20 15 100.5 0.0 -0.5 -1.0 -1.5 -2. 5.5 5.0 4.5 fl (ppm)
 Hi it's my code for python
I almost finished my project but only one thing left which is
most confusing part please help me
I have to find most occurring ending character from a to z
For instance, output should be like this I have to find a to
z.
Words starting with ‘a’ end mostly with ‘O’
Words starting with ‘b’ end mostly with ‘O’
......
No words start with ‘O’(If there's no word in the character from a...
Hi it's my code for python
I almost finished my project but only one thing left which is
most confusing part please help me
I have to find most occurring ending character from a to z
For instance, output should be like this I have to find a to
z.
Words starting with ‘a’ end mostly with ‘O’
Words starting with ‘b’ end mostly with ‘O’
......
No words start with ‘O’(If there's no word in the character from a...
 I
really need help answering these questions please. I believe the
concentration value is the bottom table.
DATA TABLE. PART 1 Temperature,°C Reaction time, s 10 37 27.8 93.Ce Le 83 35 93 lo .5 DATA TABLE. PART 2 Volume of Volume of Volume of Reaction time, s A, mL B, mL water, mL 10.0 10.0 10.0 10.0 10.0 10.0 10.0 10.0 10.0 10.0 9.0 8.0 7.0 6.0 5.0 4.0 3.0 2.0 0.0 1.0 2.0 3.0 4.0 5.0 6.0 7.0...
I
really need help answering these questions please. I believe the
concentration value is the bottom table.
DATA TABLE. PART 1 Temperature,°C Reaction time, s 10 37 27.8 93.Ce Le 83 35 93 lo .5 DATA TABLE. PART 2 Volume of Volume of Volume of Reaction time, s A, mL B, mL water, mL 10.0 10.0 10.0 10.0 10.0 10.0 10.0 10.0 10.0 10.0 9.0 8.0 7.0 6.0 5.0 4.0 3.0 2.0 0.0 1.0 2.0 3.0 4.0 5.0 6.0 7.0...
 5. Based on this analysis, the compound might be or contain
the following substructure:
6. How many different types of carbons appear to be present?
What are the chemical shifts for these carbons?
UN (43 MIL.) 10.02s, 1H), 7.716.J-2 Hz. ) 2.0 11.5 11.0 10.5 10.0 9.5 9.0 8.5 8.0 7.5 7.0 6.5 6.0 4.0 3.5 3.0 2.5 20 15 100.5 0.0 -0.5 -1.0 -1.5 -2. 5.5 5.0 4.5 fl (ppm)
5. Based on this analysis, the compound might be or contain
the following substructure:
6. How many different types of carbons appear to be present?
What are the chemical shifts for these carbons?
UN (43 MIL.) 10.02s, 1H), 7.716.J-2 Hz. ) 2.0 11.5 11.0 10.5 10.0 9.5 9.0 8.5 8.0 7.5 7.0 6.5 6.0 4.0 3.5 3.0 2.5 20 15 100.5 0.0 -0.5 -1.0 -1.5 -2. 5.5 5.0 4.5 fl (ppm)
 Below are four bivariate data sets and the scatter plot for each. (Note that each scatter plot is displayed on the same scale.) Each data set is made up of sample values drawn from a population. y 1.0 7.4 2.0 9.0 3.0 7.0 11 10- 11 102 9 8+ 7+ 8+ 71 61 5 5 41 4.0 5.4 5.0 7.5 6.05.2 7.0 4.5 8.0 7.1 9.0 5.5 10.0 3.9 V 1.0 8.0 2.0 6.9 3.07.3 4.0 6.1 5.0 7.4 6.0...
 The motion of a particle is described in the velocity vs. time graph shown in the figure. v (m/s) 5.0 4.0 3.0 2.0 1.0 2.02.0 4.0 5.0 6.0 7.0 8.0 9.0 2.0 3.0 4.0 For what time interval does the particle's direction of motion change a. Between 1 and 3 s b. Between 3 and 4 s c. Between 4 and 9 s d. Between 8 and 9 s e. the particle's direction of motion does not change at all
 3. Based on the integration of the peaks, what is the relative
number of protons which make up each signal?
4. Identify any common splitting patterns. (ie. Isopropyl,
ethyl, etc)
UN (43 MIL.) 10.02s, 1H), 7.716.J-2 Hz. ) 2.0 11.5 11.0 10.5 10.0 9.5 9.0 8.5 8.0 7.5 7.0 6.5 6.0 4.0 3.5 3.0 2.5 20 15 100.5 0.0 -0.5 -1.0 -1.5 -2. 5.5 5.0 4.5 fl (ppm)
3. Based on the integration of the peaks, what is the relative
number of protons which make up each signal?
4. Identify any common splitting patterns. (ie. Isopropyl,
ethyl, etc)
UN (43 MIL.) 10.02s, 1H), 7.716.J-2 Hz. ) 2.0 11.5 11.0 10.5 10.0 9.5 9.0 8.5 8.0 7.5 7.0 6.5 6.0 4.0 3.5 3.0 2.5 20 15 100.5 0.0 -0.5 -1.0 -1.5 -2. 5.5 5.0 4.5 fl (ppm)
Most questions answered within 3 hours.
-
Where is the error in this code sequence?
String s1 = "Hello";
String s2 = "ello";...
asked 10 months ago -
Financial data for Joel de Paris, Inc., for last year
follow:
Joel de Paris, Inc.
Balance...
asked 10 months ago -
Consider this reaction:
Al2(SO4)3 (aq)+ BaCl3
(aq) Al2Cl6 (aq)- +
3BaSO4(s) . What is the...
asked 10 months ago -
Suppose that Savneet is considering increasing her
recent random sample from 20 car rentals to 40...
asked 10 months ago -
Trucks arrive at an unloading terminal at an average rate of 120
per hour.
Trucks arrive...
asked 10 months ago -
Why are methanol and ethanol completely soluble in water while
octanol is not very little soluble....
asked 10 months ago -
A facilities manager at a university reads in a research report
that the mean amount of...
asked 10 months ago -
When the CuSO4 is rehydrated by adding water to the anhydrous
compound, is this an endothermic...
asked 10 months ago -
A ray of sunlight is passing from diamond into crown glass; the
angle of incidence is...
asked 10 months ago -
A block of mass 0.249 kg is placed on top of a light, vertical
spring of...
asked 10 months ago -
how do the kidneys compensate in the presences of acidosis
a) trigger hyperventilate
b) reserve acid...
asked 10 months ago -
Question 501 pts
The rental rate of capital to the firm increases. Which of the
following...
asked 10 months ago