


Homework Answers
I have answered all the questions in detail .
Answer have been writen with ans. start corresponding to each question.
please see below complete solution attached.


Add Answer to:
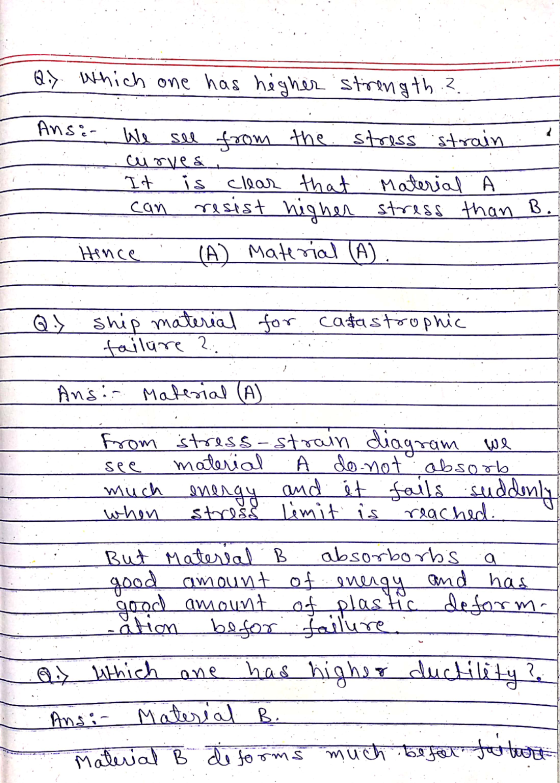
Figure (a) shows the stress strain relations for two different materials, A and B. Between A...
Problem 1 The elastic portion of the stress-strain diagram of the tested material is given below....
 Problem 1 The elastic portion of the stress-strain diagram of the tested material is given below. The specimen from which it was obtained had an original diameter of 0.5 in and a gauge length of 2 inches. When the applied load on the specimen is 4573 lb, the diameter is 0.49985 in. Determine the specimen length in inches when the load of 4573 lb is applied and calculate the material's Poisson ratio. Calculate also the rigidity modulus G in ksi....
Assignment 01 TOT Mechanical Properties of Materials 1. A tensile test specimen has a gage length...
 Assignment 01 TOT Mechanical Properties of Materials 1. A tensile test specimen has a gage length = 50 mm and its cross-sectional area = 100 mm. The specimen yields at 48,000 N, and the corresponding gage length - 50.23 mm. This is the 0.2 ent yield point. The maximum load of 87,000 N is reached at a gage length 64.2 mm. Determine (a) yield strength, (b) modulus of elasticity, and (c) tensile strength. (d) If fracture occurs at a gage...
Question 1: The stress-strain diagram for a material is shown in figure. Find the following properties...
 Question 1: The stress-strain diagram for a material is shown in figure. Find the following properties of the material. (a) Yield load if the diameter of specimen at yielding is 13mm. (b) Modulus of resilience (c) Elastic Strain Stress (MPa) CS Scanned with CamScanner 0.001 0.003 Strain
Figure 2.1 shows the stress strain curves for three materials. For these materials answer the fol...
 Figure 2.1 shows the stress strain curves for three materials. For these materials answer the following questions, giving reasons for your selection a) Which material has the highest elastic modulus? b) Which material has the highest ductility? c) Which material has the highest toughness? d) Which material has the highest yield strength? e) Which material has the highest ultimate tensile strength? f State respectively which material behaves like a: i. Metal ii. Polymer iii. Ceramic Figure 2.1 (NB. The points...
Refer to the following figure, stress-strain diagram, for samples of three different materials: A, B, and...
 Refer to the following figure, stress-strain diagram,
for samples of three different materials: A, B, and C. The end of
each curve indicates the fracture point.
e) After the conclusion of the tests, if the broken halves of each
sample were fitted back together, which sample would be the
shortest? Assume that all three samples had the same initial
length. f) A circular rod is to be produced, 15 cm long with a
diameter of 5.0 mm. This rod must...
Refer to the following figure, stress-strain diagram,
for samples of three different materials: A, B, and C. The end of
each curve indicates the fracture point.
e) After the conclusion of the tests, if the broken halves of each
sample were fitted back together, which sample would be the
shortest? Assume that all three samples had the same initial
length. f) A circular rod is to be produced, 15 cm long with a
diameter of 5.0 mm. This rod must...
Strength of materials please fast Problem 3.28 Part A The elastic portion of the stress-strain diagram...
 Strength of materials please fast
Problem 3.28 Part A The elastic portion of the stress-strain diagram for an aluminum alloy is shown in the figure below Figure 1). The specimen from which it was obtained has an original diameter of 12.7 mm and a gage length of 50.3 mm. Take -0.35 If a load of P 60 kN is applied to the specimen, determine its new diameter Express your answer to four significant figures and include appropriate units |d- 1...
Strength of materials please fast
Problem 3.28 Part A The elastic portion of the stress-strain diagram for an aluminum alloy is shown in the figure below Figure 1). The specimen from which it was obtained has an original diameter of 12.7 mm and a gage length of 50.3 mm. Take -0.35 If a load of P 60 kN is applied to the specimen, determine its new diameter Express your answer to four significant figures and include appropriate units |d- 1...
Problem No. 2 (Figure 2) (ksi) Figure 2. Upper scale Lower scale The stress-strain diagram of...
 Problem No. 2 (Figure 2) (ksi) Figure 2. Upper scale Lower scale The stress-strain diagram of a mild-steel specimen is shown in the figure. The specimen has a diameter of 0.50-inch and gage length of 2-inch. Determine the following: (a) yield strength (oy); (b) ultimate strength (out); (c) Young's modulus (E); (d) modulus of resilience; (e) if the specimen is loaded to 105 ksi and then unloaded completely, determine the permanent increase in the gage length € (in/in) 0 0.04...
Draw a schematic stress-strain diagram for steel. Make sure you mark all the important points and regions on it
 1. Draw a schematic stress-strain diagram for steel. Make sure you mark all the important points and regions on it. Provide a one-two sentence explanation for each point and region along the diagram. 2. A cylindrical specimen of a nickel alloy having an elastic modulus of 207 GPa (30 x 10* psi) and an original diameter of 10.2 mm (0.40 In.) will experience only elastic deformation when a tensile load of 8900 N (2000 Ibe) is applied. Compute the maximum length...
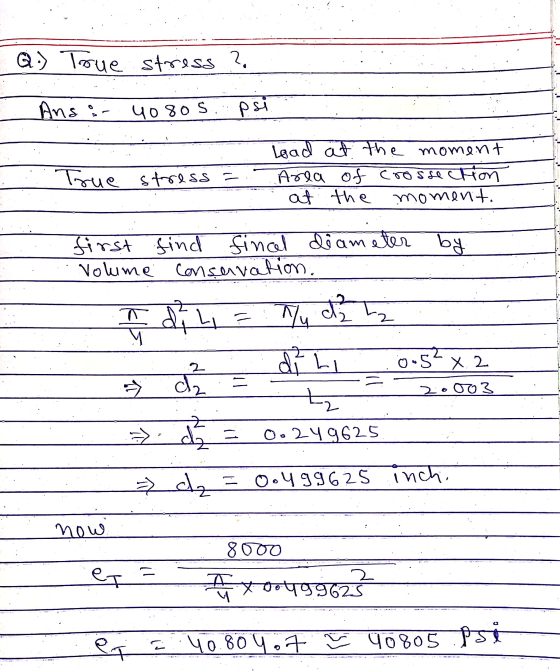
A tensile test was conducted on a specimen that had an original diameter of 0.5 in. It fractured with an applied load of 71100lb. Determine the true stress and true strain at fracture if measured diam...
A tensile test was conducted on a specimen that had an original diameter of 0.5 in. It fractured with an applied load of 71100lb. Determine the true stress and true strain at fracture if measured diameter of the fracture part was 0.3in. I believe for fracture, true stress and strain are: True strain = ln(original area/final area) True stress = applied load/final area However, Im not quite sure
1. A tensile test was performed using a standard 0.505 in. diameter specimen (Do 0.505 in)...
 1. A tensile test was performed using a standard 0.505 in. diameter specimen (Do 0.505 in) of 4140 steel with 2 inch initial gage length (Lo 2.00 in), and the following were determined: . Elastic Modulus (E)-30 x 106 psi Yield Strength (To) = 60,000 psi Strain at maximum load = 0.15 .Breaking Load (Pbreak) 15,000 lbs Maximum Load (Pa) 20,000 lbs 0 % Elongation-25% . a. (3 points) Calculate the stress at the break point: b. (5 points) Calculate...
 Problem 1 The elastic portion of the stress-strain diagram of the tested material is given below. The specimen from which it was obtained had an original diameter of 0.5 in and a gauge length of 2 inches. When the applied load on the specimen is 4573 lb, the diameter is 0.49985 in. Determine the specimen length in inches when the load of 4573 lb is applied and calculate the material's Poisson ratio. Calculate also the rigidity modulus G in ksi....
 Assignment 01 TOT Mechanical Properties of Materials 1. A tensile test specimen has a gage length = 50 mm and its cross-sectional area = 100 mm. The specimen yields at 48,000 N, and the corresponding gage length - 50.23 mm. This is the 0.2 ent yield point. The maximum load of 87,000 N is reached at a gage length 64.2 mm. Determine (a) yield strength, (b) modulus of elasticity, and (c) tensile strength. (d) If fracture occurs at a gage...
 Question 1: The stress-strain diagram for a material is shown in figure. Find the following properties of the material. (a) Yield load if the diameter of specimen at yielding is 13mm. (b) Modulus of resilience (c) Elastic Strain Stress (MPa) CS Scanned with CamScanner 0.001 0.003 Strain
 Figure 2.1 shows the stress strain curves for three materials. For these materials answer the following questions, giving reasons for your selection a) Which material has the highest elastic modulus? b) Which material has the highest ductility? c) Which material has the highest toughness? d) Which material has the highest yield strength? e) Which material has the highest ultimate tensile strength? f State respectively which material behaves like a: i. Metal ii. Polymer iii. Ceramic Figure 2.1 (NB. The points...
 Refer to the following figure, stress-strain diagram,
for samples of three different materials: A, B, and C. The end of
each curve indicates the fracture point.
e) After the conclusion of the tests, if the broken halves of each
sample were fitted back together, which sample would be the
shortest? Assume that all three samples had the same initial
length. f) A circular rod is to be produced, 15 cm long with a
diameter of 5.0 mm. This rod must...
Refer to the following figure, stress-strain diagram,
for samples of three different materials: A, B, and C. The end of
each curve indicates the fracture point.
e) After the conclusion of the tests, if the broken halves of each
sample were fitted back together, which sample would be the
shortest? Assume that all three samples had the same initial
length. f) A circular rod is to be produced, 15 cm long with a
diameter of 5.0 mm. This rod must...
 Strength of materials please fast
Problem 3.28 Part A The elastic portion of the stress-strain diagram for an aluminum alloy is shown in the figure below Figure 1). The specimen from which it was obtained has an original diameter of 12.7 mm and a gage length of 50.3 mm. Take -0.35 If a load of P 60 kN is applied to the specimen, determine its new diameter Express your answer to four significant figures and include appropriate units |d- 1...
Strength of materials please fast
Problem 3.28 Part A The elastic portion of the stress-strain diagram for an aluminum alloy is shown in the figure below Figure 1). The specimen from which it was obtained has an original diameter of 12.7 mm and a gage length of 50.3 mm. Take -0.35 If a load of P 60 kN is applied to the specimen, determine its new diameter Express your answer to four significant figures and include appropriate units |d- 1...
 Problem No. 2 (Figure 2) (ksi) Figure 2. Upper scale Lower scale The stress-strain diagram of a mild-steel specimen is shown in the figure. The specimen has a diameter of 0.50-inch and gage length of 2-inch. Determine the following: (a) yield strength (oy); (b) ultimate strength (out); (c) Young's modulus (E); (d) modulus of resilience; (e) if the specimen is loaded to 105 ksi and then unloaded completely, determine the permanent increase in the gage length € (in/in) 0 0.04...
 1. A tensile test was performed using a standard 0.505 in. diameter specimen (Do 0.505 in) of 4140 steel with 2 inch initial gage length (Lo 2.00 in), and the following were determined: . Elastic Modulus (E)-30 x 106 psi Yield Strength (To) = 60,000 psi Strain at maximum load = 0.15 .Breaking Load (Pbreak) 15,000 lbs Maximum Load (Pa) 20,000 lbs 0 % Elongation-25% . a. (3 points) Calculate the stress at the break point: b. (5 points) Calculate...
Most questions answered within 3 hours.
-
Where is the error in this code sequence?
String s1 = "Hello";
String s2 = "ello";...
asked 10 months ago -
Financial data for Joel de Paris, Inc., for last year
follow:
Joel de Paris, Inc.
Balance...
asked 10 months ago -
Consider this reaction:
Al2(SO4)3 (aq)+ BaCl3
(aq) Al2Cl6 (aq)- +
3BaSO4(s) . What is the...
asked 10 months ago -
Suppose that Savneet is considering increasing her
recent random sample from 20 car rentals to 40...
asked 10 months ago -
Trucks arrive at an unloading terminal at an average rate of 120
per hour.
Trucks arrive...
asked 10 months ago -
Why are methanol and ethanol completely soluble in water while
octanol is not very little soluble....
asked 10 months ago -
A facilities manager at a university reads in a research report
that the mean amount of...
asked 10 months ago -
When the CuSO4 is rehydrated by adding water to the anhydrous
compound, is this an endothermic...
asked 10 months ago -
A ray of sunlight is passing from diamond into crown glass; the
angle of incidence is...
asked 10 months ago -
A block of mass 0.249 kg is placed on top of a light, vertical
spring of...
asked 10 months ago -
how do the kidneys compensate in the presences of acidosis
a) trigger hyperventilate
b) reserve acid...
asked 10 months ago -
Question 501 pts
The rental rate of capital to the firm increases. Which of the
following...
asked 10 months ago