

Homework Answers
Using MiniTab 2017, Go to Stat> Control Charts > Attributes Charts > P Chart Putting Data for Output Variables and Sample Sizes = 200, We will get Below Results
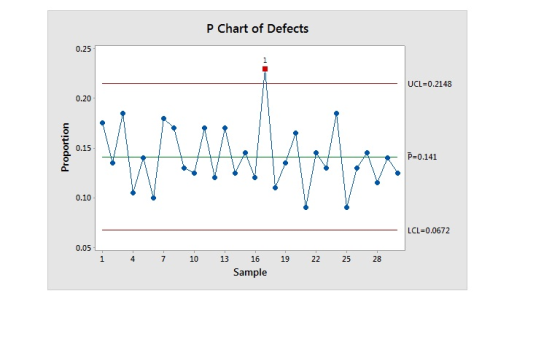
Answer for a: From the Graph, UCL value is = 0.2148 and LCL Value is =0.0672, where Z =3,
Answer for b:
Minitab Interpretation ---
Test Results for P Chart of Defects
TEST 1. One point more than 3.00 standard deviations from center
line.
Test Failed at points: 17
So,
Answer --- At least one data point above the upper control limit,
process is considered to be NOT in statistical Control
Chapter 7 Table below contains data on examination of medical insurance claims. Every day 50 claims...
Chapter 7 Table below contains data on examination of medical insurance claims. Every day 50 claims were examined. Day Number Nonconforming 1 0 2 3 3 4 4 6 5 5 6 2 7 8 8 9 9 4 10 2 11 6 12 4 13 8 14 0 15 7 16 20 17 6 18 1 19 5 20 7 Set up the fraction nonconforming control chart (p-chart) for this process. Plot the preliminary data in the above table...
Management at Webster Chemical Company is concerned as to whether caulking tubes are being properly capped....
Management at Webster Chemical Company is concerned as to whether caulking tubes are being properly capped. If a significant proportion of the tubes are not being sealed, Webster is placing its customers in a messy situation. Tubes are packaged in large boxes of 145145. Several boxes are inspected, and the following numbers of leaking tubes are found: Sample Tubes Sample Tubes Sample Tubes 1 11 8 22 15 55 2 99 9 88 16 44 3 44 10 22...
The J H group's assembly unit has decided to use a p-Chart to monitor the proportion...
The J H group's assembly unit has decided to use a p-Chart to monitor the proportion of defective castings produced by their production process. The control limits on these charts will be designed to include 97% of the sample proportions when the process is In Control. The quality control manager randomly samples 200 castings at 10 successively selected time periods and counts the number of defective castings in the sample. Sample Defects 1...............7 2...............12 3...............8 4...............14 5...............8 6...............9 7...............8 8...............8...
Jamison Kovach Supply Company manufactures paper clips and other office products. Although? inexpensive, paper clips have...
Jamison Kovach Supply Company manufactures paper clips and other office products. Although? inexpensive, paper clips have provided the firm with a high margin of profitability. Sample size is 50. Results are given for the last 10 samples. Sample 1 2 3 4 5 6 7 8 9 10 Defectives 5 7 3 6 12 5 5 4 2 12 The type of control chart that is best to monitor this process is________ a)Establish the control limits to include? 99.73% of the random variation in defectives. UCLp= ______ (enteryour response as a number between 0 and? 1,rounded to three decimal? places)....
The results of inspection of DNA samples taken over the past 10 days are given below. Sample size is 100. 10 Day Defectives 2 3 4 6 6 0 6 a) The upper and lower 3-sigma control chart limits are: UCLp...
 The results of inspection of DNA samples taken over the past 10 days are given below. Sample size is 100. 10 Day Defectives 2 3 4 6 6 0 6 a) The upper and lower 3-sigma control chart limits are: UCLp(enter your response as a number between 0 and 1, rounded to three decimal places). LCL(enter your response as a number between 0 and 1, rounded to three decimal places). b) Given the limits in part a, is the process...
Question #5 A-D. Please show work! 5. The quality control department of a company has decided...
 Question #5 A-D. Please show work!
5. The quality control department of a company has decided to select a sample of items from each shipment of goods it receives and inspect them for defects. It has been decided that if the sample contains no defective parts, the entire lot will be accepted. Thirty samples, each consisting of 200 items, were selected and examined when the shipping process was known to be operating correctly. The numbers of defective items found in...
Question #5 A-D. Please show work!
5. The quality control department of a company has decided to select a sample of items from each shipment of goods it receives and inspect them for defects. It has been decided that if the sample contains no defective parts, the entire lot will be accepted. Thirty samples, each consisting of 200 items, were selected and examined when the shipping process was known to be operating correctly. The numbers of defective items found in...
Smith and Johnson Industries has decided to use a p-Chart with 3-sigma control limits to monitor...
Smith and Johnson Industries has decided to use a p-Chart with 3-sigma control limits to monitor the proportion of defective galvanized pipes produced by their production process. The quality control manager randomly samples 150 galvanized pipes at 16 successively selected time periods and counts the number of defective galvanized pipes in the sample. Step 1 of 8: What is the Center Line of the control chart? Round your answer to three decimal places. Step 2 of 8: What value of...
A marathoner is now running his marathons with an average time of 3 hours, and 15...
A marathoner is now running his marathons with an average time of 3 hours, and 15 minutes, and a standard deviation of 15 minute and her times follow a normal distribution. What is the probability of the marathoner running a marathon time of exactly 2 hours and 58 minutes? 0.00 0.05 0.15 0.12 Which of the following would indicate a process has special causes of variation? A point is above the lower control limit and below the upper control limit...
Daily samples of 150 sand filters are removed from Pentair Corporation's assembly line and inspected for...
Daily samples of 150 sand filters are removed from Pentair Corporation's assembly line and inspected for defects. Over the past 22 days, the following information has been gathered. Develop a (95.45% confidence level) p-chart. Day Number of Defective Filters Day Number of Defective Filters 1 7 12 9 2 15 13 11 3 11 14 20 4 17 15 21 5 12 16 12 6 4 17 6 7 5 18 13 8 10 19 4 9 6 20 6...
Another defect type you would like to control using appropriate SPC technique is appearance of stain...
 Another defect type you would like to control using appropriate
SPC technique is
appearance of stain in the round neck shirts. You obtain the
following data:
a. How many set of upper control limits and lower control limits
have to be
calculated?
b. Compute for the center line and Upper Control limit and also
Lower control limit
c. Is the process operating in statistical control?[Why?
Sample # of stain in size the shirts SUBGROUP .com/webapps/assessment/review/review.jsp?attempt id_3 Review Test Submission: CO...
Another defect type you would like to control using appropriate
SPC technique is
appearance of stain in the round neck shirts. You obtain the
following data:
a. How many set of upper control limits and lower control limits
have to be
calculated?
b. Compute for the center line and Upper Control limit and also
Lower control limit
c. Is the process operating in statistical control?[Why?
Sample # of stain in size the shirts SUBGROUP .com/webapps/assessment/review/review.jsp?attempt id_3 Review Test Submission: CO...
 The results of inspection of DNA samples taken over the past 10 days are given below. Sample size is 100. 10 Day Defectives 2 3 4 6 6 0 6 a) The upper and lower 3-sigma control chart limits are: UCLp(enter your response as a number between 0 and 1, rounded to three decimal places). LCL(enter your response as a number between 0 and 1, rounded to three decimal places). b) Given the limits in part a, is the process...
 Question #5 A-D. Please show work!
5. The quality control department of a company has decided to select a sample of items from each shipment of goods it receives and inspect them for defects. It has been decided that if the sample contains no defective parts, the entire lot will be accepted. Thirty samples, each consisting of 200 items, were selected and examined when the shipping process was known to be operating correctly. The numbers of defective items found in...
Question #5 A-D. Please show work!
5. The quality control department of a company has decided to select a sample of items from each shipment of goods it receives and inspect them for defects. It has been decided that if the sample contains no defective parts, the entire lot will be accepted. Thirty samples, each consisting of 200 items, were selected and examined when the shipping process was known to be operating correctly. The numbers of defective items found in...
 Another defect type you would like to control using appropriate
SPC technique is
appearance of stain in the round neck shirts. You obtain the
following data:
a. How many set of upper control limits and lower control limits
have to be
calculated?
b. Compute for the center line and Upper Control limit and also
Lower control limit
c. Is the process operating in statistical control?[Why?
Sample # of stain in size the shirts SUBGROUP .com/webapps/assessment/review/review.jsp?attempt id_3 Review Test Submission: CO...
Another defect type you would like to control using appropriate
SPC technique is
appearance of stain in the round neck shirts. You obtain the
following data:
a. How many set of upper control limits and lower control limits
have to be
calculated?
b. Compute for the center line and Upper Control limit and also
Lower control limit
c. Is the process operating in statistical control?[Why?
Sample # of stain in size the shirts SUBGROUP .com/webapps/assessment/review/review.jsp?attempt id_3 Review Test Submission: CO...
Most questions answered within 3 hours.
-
Where is the error in this code sequence?
String s1 = "Hello";
String s2 = "ello";...
asked 11 months ago -
Financial data for Joel de Paris, Inc., for last year
follow:
Joel de Paris, Inc.
Balance...
asked 11 months ago -
Consider this reaction:
Al2(SO4)3 (aq)+ BaCl3
(aq) Al2Cl6 (aq)- +
3BaSO4(s) . What is the...
asked 11 months ago -
Suppose that Savneet is considering increasing her
recent random sample from 20 car rentals to 40...
asked 11 months ago -
Trucks arrive at an unloading terminal at an average rate of 120
per hour.
Trucks arrive...
asked 11 months ago -
Why are methanol and ethanol completely soluble in water while
octanol is not very little soluble....
asked 11 months ago -
A facilities manager at a university reads in a research report
that the mean amount of...
asked 11 months ago -
When the CuSO4 is rehydrated by adding water to the anhydrous
compound, is this an endothermic...
asked 11 months ago -
A ray of sunlight is passing from diamond into crown glass; the
angle of incidence is...
asked 11 months ago -
A block of mass 0.249 kg is placed on top of a light, vertical
spring of...
asked 11 months ago -
how do the kidneys compensate in the presences of acidosis
a) trigger hyperventilate
b) reserve acid...
asked 11 months ago -
Question 501 pts
The rental rate of capital to the firm increases. Which of the
following...
asked 11 months ago