
Homework Answers
First i have draw the plot of x,y with outlier

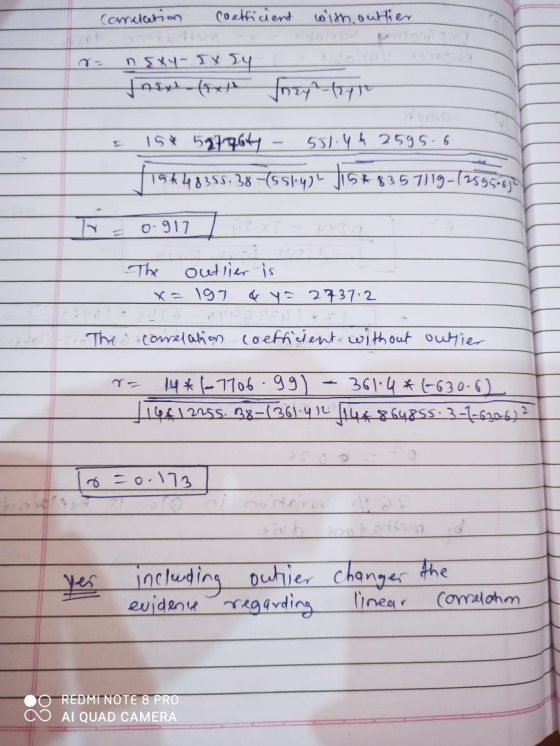
The outlier is (190,2737.2)
plot( x,y ) without outlier
Add Answer to:
The following bivariate data set contains an outlier. х 33.1 48.1 0.8 17.5 36.3 46.7 11.2...
The following bivariate data set contains an outlier. x y 48.9 43.4 33.2 483.2 63.3 -182.8...
The following bivariate data set contains an outlier. x y 48.9 43.4 33.2 483.2 63.3 -182.8 44.5 -22.7 40.6 -84.6 71.1 75.3 45.9 -126.9 16.1 343.7 44.3 77.1 53 -294 30.5 -94.2 53.9 2.1 6.9 491.9 65.5 -13 263.7 2849.6 What is the correlation coefficient with the outlier? rw = What is the correlation coefficient without the outlier? rwo = Would inclusion of the outlier change the evidence for or against a significant linear correlation? Yes. Including the outlier changes...
BNOWIESLpRp:action skip&to 24®en 24 The following bivariate data set contains an outlier. 35.1 999.6 5.9 4368.4...
 BNOWIESLpRp:action skip&to 24®en 24 The following bivariate data set contains an outlier. 35.1 999.6 5.9 4368.4 11.9 2435 42.6 7065.2 16.8 2235.5 979 29 1745.3 63.9 2257.3 8 -1538.8 16 3523 18.9 2190.5 37.6 655.4 37.5 729.2 49.7 1716.9 273.3 -569.6 37.9 Linear Regression and Correlation Calculator What is the correlation coefficient with the outlier? What is the correlation coefficient without the outlier?
 BNOWIESLpRp:action skip&to 24®en 24 The following bivariate data set contains an outlier. 35.1 999.6 5.9 4368.4 11.9 2435 42.6 7065.2 16.8 2235.5 979 29 1745.3 63.9 2257.3 8 -1538.8 16 3523 18.9 2190.5 37.6 655.4 37.5 729.2 49.7 1716.9 273.3 -569.6 37.9 Linear Regression and Correlation Calculator What is the correlation coefficient with the outlier? What is the correlation coefficient without the outlier?
Most questions answered within 3 hours.
-
Where is the error in this code sequence?
String s1 = "Hello";
String s2 = "ello";...
asked 10 months ago -
Financial data for Joel de Paris, Inc., for last year
follow:
Joel de Paris, Inc.
Balance...
asked 10 months ago -
Consider this reaction:
Al2(SO4)3 (aq)+ BaCl3
(aq) Al2Cl6 (aq)- +
3BaSO4(s) . What is the...
asked 10 months ago -
Suppose that Savneet is considering increasing her
recent random sample from 20 car rentals to 40...
asked 10 months ago -
Trucks arrive at an unloading terminal at an average rate of 120
per hour.
Trucks arrive...
asked 10 months ago -
Why are methanol and ethanol completely soluble in water while
octanol is not very little soluble....
asked 10 months ago -
A facilities manager at a university reads in a research report
that the mean amount of...
asked 10 months ago -
When the CuSO4 is rehydrated by adding water to the anhydrous
compound, is this an endothermic...
asked 10 months ago -
A ray of sunlight is passing from diamond into crown glass; the
angle of incidence is...
asked 10 months ago -
A block of mass 0.249 kg is placed on top of a light, vertical
spring of...
asked 10 months ago -
how do the kidneys compensate in the presences of acidosis
a) trigger hyperventilate
b) reserve acid...
asked 10 months ago -
Question 501 pts
The rental rate of capital to the firm increases. Which of the
following...
asked 10 months ago