
Homework Answers

Add Answer to:
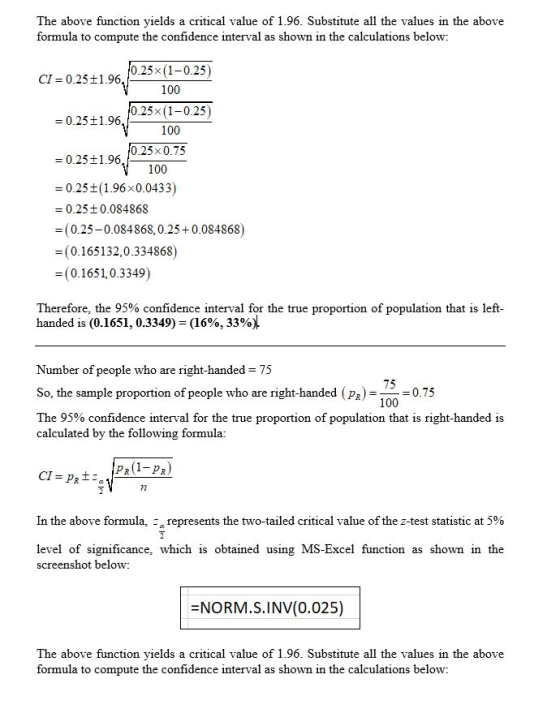
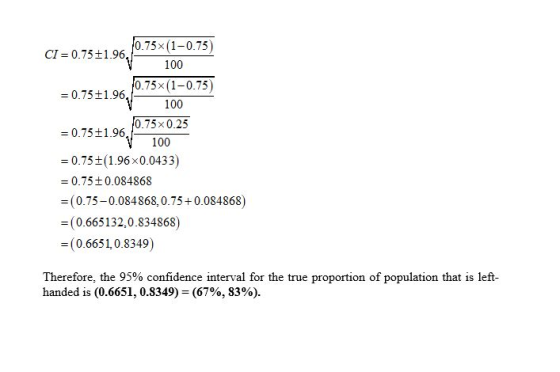
The table below shows which hand is favored by each person from a sample of 100...
A random sample of 2000 people was taken. 800 of the people in the sample favored...
A random sample of 2000 people was taken. 800 of the people in the sample favored Candidate A. The 95% confidence interval for the true proportion of people who favor Candidate A is 0.440 to 0.460 0.355 to 0.445 0.379 to 0.421 0.345 to 0.455 0.375 to 0.425 0.391 to 0.409
We will be using Excel to simulate the number of left-handed people in a particular sample....
We will be using Excel to simulate the number of left-handed people in a particular sample. Left-handed people make up about 10% of the population. We will randomly pick numbers between 1 and 10, where 1 represents a left-handed person and 2 - 10 represents a right-handed person. This should result in about 10% of our sample being left-handed. Please note there are five parts to this question. 1. Create a pie graph in Excel to show the proportion of...
If a person is selected at random, find the probability of each event Male Female Total...
If a person is selected at random, find the probability of each event Male Female Total Left 63 50 113 Right 462 425 887 Total 525 475 1000 a)Find the probability of being left handed. b)Find the probability of being right handed given that you are female.
Conditional Probability. Let's say, table below shows number of people who work for the company located...
Conditional Probability. Let's say, table below shows number of people who work for the company located in Manhattan and live in NY, NJ or CT. Put any numbers in this table: NY - NJ - CT Male ... - ... - ... Female ... - ... - ... Based on data in your table find probability that randomly selected person from this company: 1) is Female AND lives in NY: P(F and NY); 2) is Male OR lives in NJ:...
The contingency table below shows marital status for 100 randomly selected adults by gender. Find the...
The contingency table below shows marital status for 100 randomly selected adults by gender. Find the probability that a randomly selected adult is married, given that the person is female, and then find the probability that a randomly selected adult is female, given that the person is married Married Unmarried Total Male 14 26 40 Female 41 19 60 Total 55 45 100
If a person from your data set is randomly selected, find the probability that they are...
 If a person from your data set
is randomly selected, find the probability that they are
left-handed or male.
L=ledt, R=Right, 1=Female, 2=male
Tabulated Statistics: gender, handedness Rows: gender Colums: handedness L R Missing All 2 Missing 18 248 15 114 2 0 266 1 12에
If a person from your data set
is randomly selected, find the probability that they are
left-handed or male.
L=ledt, R=Right, 1=Female, 2=male
Tabulated Statistics: gender, handedness Rows: gender Colums: handedness L R Missing All 2 Missing 18 248 15 114 2 0 266 1 12에
In a poll of 175 randomly selected U.S. adults, 94 said they favored a new proposition....
 In a poll of 175 randomly selected U.S. adults, 94 said they favored a new proposition. Based on this poll, compute a 95% confidence interval for the proportion of all U.S. adults in favor of the proposition (at the time of the poll). Then complete the table below Carry your intermediate computations to at least three decimal places. Round your answers to two decimal places. (If necessary, consult a list of formulas.) What is the lower limit of the 95%...
Question Help - Use the sample data and confidence level given below to complete parts (a)...
 Question Help - Use the sample data and confidence level given below to complete parts (a) through (d) In a study of cell phone use and brain hemispheric dominance, an Internet survey was e-mailed to 2376 subjects randomly selected from an online group involved with ears. 955 surveys were returned. Construct a 95% confidence interval for the proportion of returned surveys Click the icon to view a table of z scores a) Find the best point estimate of the population...
Use the sample data and confidence level given below to complete parts (a) through (d). In...
 Use the sample data and confidence level given below to complete parts (a) through (d). In a study of cell phone use and brain hemispheric dominance, an Internet survey was e-mailed to 2424 subjects randomly selected from an online group involved with ears, 1154 surveys were returned. Construct a 95% confidence interval for the proportion of returned surveys. Cick the icon to view a table of z scores a) Find the best point estimate of the population proportion p. (Round...
John has obtained two independent samples form two populations, where the sample statistics are shown in...
John has obtained two independent samples form two populations, where the sample statistics are shown in the table below. Assuming equal variances, he can construct a 95% confidence interval for the difference of the population means to be Sample 1 Sample 2 Mean 22.7 20.5 Variances (s^2) 5.4 3.6 Observations (sample size) 9 9 [0.08, 4.32] [1.17,5.08] [2.44,6.19] [-0.09,3.19] True or False? A new policy of “flex hours” is proposed. Random Sampling showed that 40 of 50 female workers favored...
 If a person from your data set
is randomly selected, find the probability that they are
left-handed or male.
L=ledt, R=Right, 1=Female, 2=male
Tabulated Statistics: gender, handedness Rows: gender Colums: handedness L R Missing All 2 Missing 18 248 15 114 2 0 266 1 12에
If a person from your data set
is randomly selected, find the probability that they are
left-handed or male.
L=ledt, R=Right, 1=Female, 2=male
Tabulated Statistics: gender, handedness Rows: gender Colums: handedness L R Missing All 2 Missing 18 248 15 114 2 0 266 1 12에
 In a poll of 175 randomly selected U.S. adults, 94 said they favored a new proposition. Based on this poll, compute a 95% confidence interval for the proportion of all U.S. adults in favor of the proposition (at the time of the poll). Then complete the table below Carry your intermediate computations to at least three decimal places. Round your answers to two decimal places. (If necessary, consult a list of formulas.) What is the lower limit of the 95%...
 Question Help - Use the sample data and confidence level given below to complete parts (a) through (d) In a study of cell phone use and brain hemispheric dominance, an Internet survey was e-mailed to 2376 subjects randomly selected from an online group involved with ears. 955 surveys were returned. Construct a 95% confidence interval for the proportion of returned surveys Click the icon to view a table of z scores a) Find the best point estimate of the population...
 Use the sample data and confidence level given below to complete parts (a) through (d). In a study of cell phone use and brain hemispheric dominance, an Internet survey was e-mailed to 2424 subjects randomly selected from an online group involved with ears, 1154 surveys were returned. Construct a 95% confidence interval for the proportion of returned surveys. Cick the icon to view a table of z scores a) Find the best point estimate of the population proportion p. (Round...
Most questions answered within 3 hours.
-
Where is the error in this code sequence?
String s1 = "Hello";
String s2 = "ello";...
asked 10 months ago -
Financial data for Joel de Paris, Inc., for last year
follow:
Joel de Paris, Inc.
Balance...
asked 10 months ago -
Consider this reaction:
Al2(SO4)3 (aq)+ BaCl3
(aq) Al2Cl6 (aq)- +
3BaSO4(s) . What is the...
asked 10 months ago -
Suppose that Savneet is considering increasing her
recent random sample from 20 car rentals to 40...
asked 10 months ago -
Trucks arrive at an unloading terminal at an average rate of 120
per hour.
Trucks arrive...
asked 10 months ago -
Why are methanol and ethanol completely soluble in water while
octanol is not very little soluble....
asked 10 months ago -
A facilities manager at a university reads in a research report
that the mean amount of...
asked 10 months ago -
When the CuSO4 is rehydrated by adding water to the anhydrous
compound, is this an endothermic...
asked 10 months ago -
A ray of sunlight is passing from diamond into crown glass; the
angle of incidence is...
asked 10 months ago -
A block of mass 0.249 kg is placed on top of a light, vertical
spring of...
asked 10 months ago -
how do the kidneys compensate in the presences of acidosis
a) trigger hyperventilate
b) reserve acid...
asked 10 months ago -
Question 501 pts
The rental rate of capital to the firm increases. Which of the
following...
asked 10 months ago