QUESTION 5
In the following figure, which area represents producer
surplus?

| a. | Area C | |
| b. | Area A | |
| c. | Area B |
1 points
QUESTION 6
Which of the following represents producer
surplus?

| a. | B+A | |
| b. | B | |
| c. | A |
1 points
QUESTION 7
Refer to the figure below. Producer surplus
is:
| a. | $180 | |
| b. | $60 | |
| c. | $420 |
1 points
QUESTION 8
Social surplus is ________.
| a. | the sum of consumer surplus and producer surplus | |
| b. | consumer surplus minus producer surplus | |
| c. | producer surplus minus consumer surplus |
Homework Answers
1.
The answer is a.Area C
The area under the price and over the supply curve is the producer
surplus.
2.
The answer is b.B
The area under the price and over the supply curve is the producer
surplus.
3.
The answer is a.$180
Producer surplus=0.5*(14-2)*(30)=180
4.
a.the sum of consumer surplus and producer surplus
Social surplus is the sum of consumer surplus and producer
surplus.
Add Answer to:
QUESTION 5
In the following figure, which area represents producer
surplus?
a.
Area C
b.
Area...
QUESTION 7 Figure: The vertical distance between points A and C represents a tax in the...
 QUESTION 7 Figure: The vertical distance between points A and C represents a tax in the market. T Price Supply 1000 900+ 800 700+ 600 + 500+ 400 300 C 200+ 100 Demand 10 20 30 40 50 60 70 80 90 100110 Quantty Refer to Figure. After the taxes a. there will be a loss to the consumers of the amount $4,000. Б. there will be a loss to the consumers of the amount S6,000. Cthere will be a...
Question 5 Welfare for a country is equal to consumer surplus consumer surplus minus producer surplus...
 Question 5 Welfare for a country is equal to consumer surplus consumer surplus minus producer surplus consumer surplus plus producer Surplus plus tariffrevenues consumer surplus plus producer Surplus minus tariff revenues Question 6 Use the graph below to answer this question: In autarky (before trade) consumer surplus is the area represented by the letter(s) (For this question and the following ones that use the same graph. Sis domestic supply. Dis domestic demand Pw is the world price is the tarif)
5. Consumer surplus, producer surplus, and deadweight loss with quantity restrictions The following graph shows the...
 5. Consumer surplus, producer surplus, and deadweight loss with quantity restrictions The following graph shows the supply of (orange curve) and demand for (blue curve) DVD players. Determine the equilibrium price and quantity of DVD players. Based on this, use the green triangle (triangle symbols) to shade the area representing consumer surplus at the equilibrium price. Then, use the purple triangle (diamond symbols) to shade the area representing producer surplus at the equilibrium price. 200 180 Demand Consumer Surplus Producer...
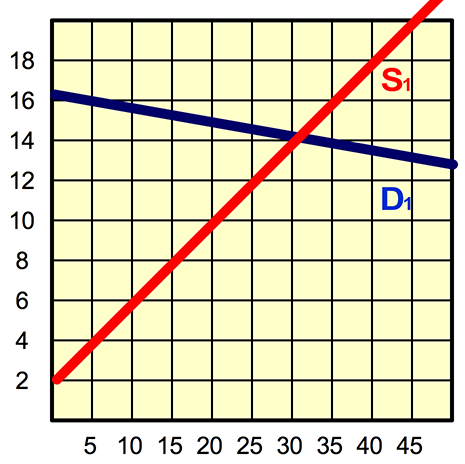
QUESTION 1 Refer to the figure below. Producer surplus is 18 14 12 8 6 4...
 QUESTION 1 Refer to the figure below. Producer surplus is 18 14 12 8 6 4 2 5 10 15 20 25 30 35 40 45 a. $60 b.$420 c. $180
QUESTION 3 Figure Price Supply P K I P" P B M N Demand Quantity Refer...
 QUESTION 3 Figure Price Supply P K I P" P B M N Demand Quantity Refer to Figure. If the government imposes a tax size of P- P" in the above market then the area L+M+Y represents a. consumer surplus after the tax. producer surplus after the tax. Cconsumer surplus before the tax. producer surplus before the tax. QUESTION 4 4 point Figure Supply Dennd Quantity Q1 02 Q3 Q Qs Refer to Figure. If the government impose a tax...
D Question 20 1 pts Figure 8-7 The vertical distance between points A and B represents...
 D Question 20 1 pts Figure 8-7 The vertical distance between points A and B represents a tax in the market. Price 24 Supply 20 18 l6 14 10 5 10 15 20 25 30 35 40 45 0 55 60 Danti Refer to Figure 8-7. Which of the following statements is correct? The loss of producer surplus that is associated with some sellers dropping out of the market as a result of the tax is $30. 。The loss of...
econ 211 A Question 3 Refer to Figure 7-2 Which area represents the increase in consumer...
 econ 211
A Question 3 Refer to Figure 7-2 Which area represents the increase in consumer surplus when the price falls from P1 to P2? ABD ACG DFG BCGD Question 4 Refer to Figure 10-1 Supply esc # $ % & 2 3 4 5
econ 211
A Question 3 Refer to Figure 7-2 Which area represents the increase in consumer surplus when the price falls from P1 to P2? ABD ACG DFG BCGD Question 4 Refer to Figure 10-1 Supply esc # $ % & 2 3 4 5
Figure 9-11 Price Domestic Supply World Price Domestic Demand Quantity Refer to Figure 9.11. Consumer surplus in...
 Figure 9-11 Price Domestic Supply World Price Domestic Demand Quantity Refer to Figure 9.11. Consumer surplus in this market before trade is O a. A Ob. B+C O c. A+B+D. O d.c. Supply Demand Refer to Figure 7-21. Which area represents consumer surplus when the price is P1? O a. A O b.B ос. С To a.D
Part 1 (a) Which area represents consumer surplus under perfect competition? ABH? ACG? DCG? (b) Which...
 Part 1
(a) Which area represents consumer surplus under perfect
competition? ABH? ACG? DCG?
(b) Which area represents producer surplus under perfect
competition? DCG? BHJD? ACG?
Part 2
(a) Which area represents consumer surplus under monopoly? BHJD?
ACG? ABH?
(b) Which area represents producer surplus under monopoly? BHJD?
CDG? ABH?
Part 3
Which area represents the deadweight loss associated with a
monopoly? HGJ? BHGC? HGFE?
Price and cost MC Market quantity
Part 1
(a) Which area represents consumer surplus under perfect
competition? ABH? ACG? DCG?
(b) Which area represents producer surplus under perfect
competition? DCG? BHJD? ACG?
Part 2
(a) Which area represents consumer surplus under monopoly? BHJD?
ACG? ABH?
(b) Which area represents producer surplus under monopoly? BHJD?
CDG? ABH?
Part 3
Which area represents the deadweight loss associated with a
monopoly? HGJ? BHGC? HGFE?
Price and cost MC Market quantity
Figure 8-2 The vertical distance between points A and B represents a tax in the market....
 Figure 8-2 The vertical distance between points A and B represents a tax in the market. Supply Demand 05 is OS 1 15 2 25 3 35 4 4S 5 Quantity Refer to Figure 8-2. Producer surplus without the tax is $10, and producer surplus with the tax is $1. $4, and producer surplus with the tax is $1. $10, and producer surplus with the tax is $3. $4, and producer surplus with the tax is $3.
 QUESTION 7 Figure: The vertical distance between points A and C represents a tax in the market. T Price Supply 1000 900+ 800 700+ 600 + 500+ 400 300 C 200+ 100 Demand 10 20 30 40 50 60 70 80 90 100110 Quantty Refer to Figure. After the taxes a. there will be a loss to the consumers of the amount $4,000. Б. there will be a loss to the consumers of the amount S6,000. Cthere will be a...
 Question 5 Welfare for a country is equal to consumer surplus consumer surplus minus producer surplus consumer surplus plus producer Surplus plus tariffrevenues consumer surplus plus producer Surplus minus tariff revenues Question 6 Use the graph below to answer this question: In autarky (before trade) consumer surplus is the area represented by the letter(s) (For this question and the following ones that use the same graph. Sis domestic supply. Dis domestic demand Pw is the world price is the tarif)
 5. Consumer surplus, producer surplus, and deadweight loss with quantity restrictions The following graph shows the supply of (orange curve) and demand for (blue curve) DVD players. Determine the equilibrium price and quantity of DVD players. Based on this, use the green triangle (triangle symbols) to shade the area representing consumer surplus at the equilibrium price. Then, use the purple triangle (diamond symbols) to shade the area representing producer surplus at the equilibrium price. 200 180 Demand Consumer Surplus Producer...
 QUESTION 1 Refer to the figure below. Producer surplus is 18 14 12 8 6 4 2 5 10 15 20 25 30 35 40 45 a. $60 b.$420 c. $180
 QUESTION 3 Figure Price Supply P K I P" P B M N Demand Quantity Refer to Figure. If the government imposes a tax size of P- P" in the above market then the area L+M+Y represents a. consumer surplus after the tax. producer surplus after the tax. Cconsumer surplus before the tax. producer surplus before the tax. QUESTION 4 4 point Figure Supply Dennd Quantity Q1 02 Q3 Q Qs Refer to Figure. If the government impose a tax...
 D Question 20 1 pts Figure 8-7 The vertical distance between points A and B represents a tax in the market. Price 24 Supply 20 18 l6 14 10 5 10 15 20 25 30 35 40 45 0 55 60 Danti Refer to Figure 8-7. Which of the following statements is correct? The loss of producer surplus that is associated with some sellers dropping out of the market as a result of the tax is $30. 。The loss of...
 econ 211
A Question 3 Refer to Figure 7-2 Which area represents the increase in consumer surplus when the price falls from P1 to P2? ABD ACG DFG BCGD Question 4 Refer to Figure 10-1 Supply esc # $ % & 2 3 4 5
econ 211
A Question 3 Refer to Figure 7-2 Which area represents the increase in consumer surplus when the price falls from P1 to P2? ABD ACG DFG BCGD Question 4 Refer to Figure 10-1 Supply esc # $ % & 2 3 4 5
 Figure 9-11 Price Domestic Supply World Price Domestic Demand Quantity Refer to Figure 9.11. Consumer surplus in this market before trade is O a. A Ob. B+C O c. A+B+D. O d.c. Supply Demand Refer to Figure 7-21. Which area represents consumer surplus when the price is P1? O a. A O b.B ос. С To a.D
 Part 1
(a) Which area represents consumer surplus under perfect
competition? ABH? ACG? DCG?
(b) Which area represents producer surplus under perfect
competition? DCG? BHJD? ACG?
Part 2
(a) Which area represents consumer surplus under monopoly? BHJD?
ACG? ABH?
(b) Which area represents producer surplus under monopoly? BHJD?
CDG? ABH?
Part 3
Which area represents the deadweight loss associated with a
monopoly? HGJ? BHGC? HGFE?
Price and cost MC Market quantity
Part 1
(a) Which area represents consumer surplus under perfect
competition? ABH? ACG? DCG?
(b) Which area represents producer surplus under perfect
competition? DCG? BHJD? ACG?
Part 2
(a) Which area represents consumer surplus under monopoly? BHJD?
ACG? ABH?
(b) Which area represents producer surplus under monopoly? BHJD?
CDG? ABH?
Part 3
Which area represents the deadweight loss associated with a
monopoly? HGJ? BHGC? HGFE?
Price and cost MC Market quantity
 Figure 8-2 The vertical distance between points A and B represents a tax in the market. Supply Demand 05 is OS 1 15 2 25 3 35 4 4S 5 Quantity Refer to Figure 8-2. Producer surplus without the tax is $10, and producer surplus with the tax is $1. $4, and producer surplus with the tax is $1. $10, and producer surplus with the tax is $3. $4, and producer surplus with the tax is $3.
Most questions answered within 3 hours.
-
Where is the error in this code sequence?
String s1 = "Hello";
String s2 = "ello";...
asked 10 months ago -
Financial data for Joel de Paris, Inc., for last year
follow:
Joel de Paris, Inc.
Balance...
asked 10 months ago -
Consider this reaction:
Al2(SO4)3 (aq)+ BaCl3
(aq) Al2Cl6 (aq)- +
3BaSO4(s) . What is the...
asked 10 months ago -
Suppose that Savneet is considering increasing her
recent random sample from 20 car rentals to 40...
asked 10 months ago -
Trucks arrive at an unloading terminal at an average rate of 120
per hour.
Trucks arrive...
asked 10 months ago -
Why are methanol and ethanol completely soluble in water while
octanol is not very little soluble....
asked 10 months ago -
A facilities manager at a university reads in a research report
that the mean amount of...
asked 10 months ago -
When the CuSO4 is rehydrated by adding water to the anhydrous
compound, is this an endothermic...
asked 10 months ago -
A ray of sunlight is passing from diamond into crown glass; the
angle of incidence is...
asked 10 months ago -
A block of mass 0.249 kg is placed on top of a light, vertical
spring of...
asked 10 months ago -
how do the kidneys compensate in the presences of acidosis
a) trigger hyperventilate
b) reserve acid...
asked 10 months ago -
Question 501 pts
The rental rate of capital to the firm increases. Which of the
following...
asked 10 months ago