
Homework Answers


Add Answer to:
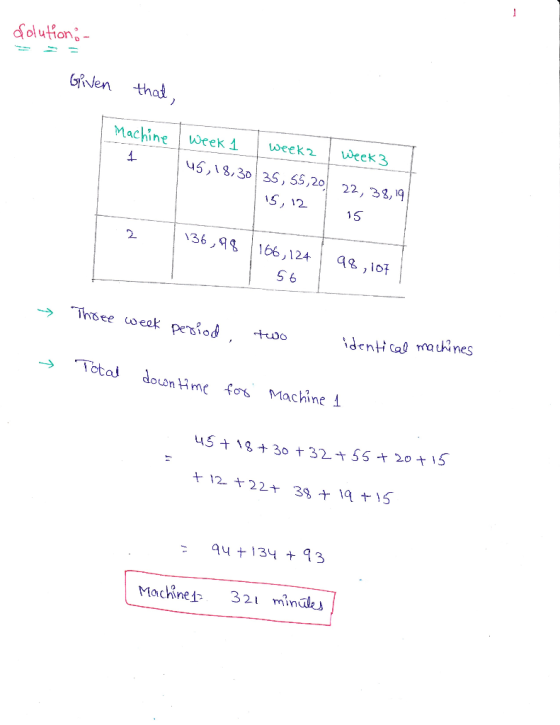
1. During a three-week period, two identical machines have the following record of downtime (in minutes)...
The following data represents the number of consecutive minutes (to the nearest minute) 2. spent on...
 The following data represents the number of consecutive minutes (to the nearest minute) 2. spent on mobile phones by students attending the University of A. 23 2 26 40 22 52 28 40 19 55 50 52 51 46 51 60 59 45 26 2 48 1 34 10 18 45 29 41 11 43 50 32 37 15 57 17 57 35 50 45 7 22 15 13 20 13 15 32 13 39 25 38 31 16 7...
1. Forecast demand for Year 4. a. Explain what technique you utilized to forecast your demand....
 1. Forecast demand for Year 4.
a. Explain what technique you utilized to forecast your
demand.
b. Explain why you chose this technique over others.
Year 3 Year 1 Year 2 Actual Actual Actual Forecast Forecast Forecast Demand Demand Demand Week 1 52 57 63 55 66 77 Week 2 49 58 68 69 75 65 Week 3 47 50 58 65 80 74 Week 4 60 53 58 55 78 67 57 Week 5 49 57 64 76 77...
1. Forecast demand for Year 4.
a. Explain what technique you utilized to forecast your
demand.
b. Explain why you chose this technique over others.
Year 3 Year 1 Year 2 Actual Actual Actual Forecast Forecast Forecast Demand Demand Demand Week 1 52 57 63 55 66 77 Week 2 49 58 68 69 75 65 Week 3 47 50 58 65 80 74 Week 4 60 53 58 55 78 67 57 Week 5 49 57 64 76 77...
Your IT department provided you data on patients that received ER services, their GHHS, and their recovery time. Prepare a report to share with the owners of the facility that will help you make infor...
Your IT department provided you data on patients that received ER services, their GHHS, and their recovery time. Prepare a report to share with the owners of the facility that will help you make informed decisions about how long you can expect a patients’ recovery time would be based on their GHHS. Based on your findings provide recommendations on your plan moving forward to improve the functioning of your facilities in generating revenue. Prepare a report that addresses each of...
Question 1: Compute the linear regression equation (coefficients) between the “year” variable and the “temperature” variable. In other words, the dependent variable will be the temperature and the ind...
 Question 1: Compute the linear regression
equation (coefficients) between the “year” variable and the
“temperature” variable. In other words, the dependent variable will
be the temperature and the independent variable will be “year”
variable. Write down the equation, the correlation coefficient
R and the standard error.
Question 2.
a. Has the annual temperature trend given by
the regression line increased or decreased? Hint: Which of the
regression line coefficients expresses whether the linear
relationship between temperature and time (in years)...
Question 1: Compute the linear regression
equation (coefficients) between the “year” variable and the
“temperature” variable. In other words, the dependent variable will
be the temperature and the independent variable will be “year”
variable. Write down the equation, the correlation coefficient
R and the standard error.
Question 2.
a. Has the annual temperature trend given by
the regression line increased or decreased? Hint: Which of the
regression line coefficients expresses whether the linear
relationship between temperature and time (in years)...
You have two groups of apples (data below). You want to see if there is a...
You have two groups of apples (data below). You want to see if there is a statistical differnce between the two groups. Run descriptives and a two tailed, two sample assuming equal variance t-test. Here's your data: Weight of Apples in Grams Apple ID Farm A Farm B 1 131 151 2 147 159 3 134 162 4 134 158 5 136 159 6 137 160 7 140 150 8 134 160 9 136 160 10 133 160 11 134...
The data from data349.dat contains information on 78 seventh-grade students. We want to know how well each of IQ score a...
The data from data349.dat contains information on 78 seventh-grade students. We want to know how well each of IQ score and self-concept score predicts GPA using least-squares regression. We also want to know which of these explanatory variables predicts GPA better. Give numerical measures that answer these questions. (Round your answers to three decimal places.) (Regressor: IQ) R 2 (Regressor: Self-Concept) R 2 Which variable is the better predictor? IQ Self Concept obs gpa iq gender concept 1 7.94 112 ...
Subject 5 (10%) Is there a difference between the means of the total of rooms per...
Subject 5 (10%) Is there a difference between the means of the total of rooms per hotel in Crete and Southern Aegean Islands? Answer your question by calculating an appropriate, symmetric, 95% confidence interval using a Z statistic and equal standard deviations in the two populations. Explain your findings. Region ID : 1= Crete 2=Southern Aegean Islands 3=Ionian Islands STARS Total_Rooms Region_ID ARR_MAY ARR_AUG L_COST 5 412 1 95 160 2.165.000 5 313 1 94 173 2.214.985 5 265 1...
can i please get help on identifying my unknown and answering the questions for each part....
 can
i please get help on identifying my unknown and answering the
questions for each part. and please explain because i will be given
an exam like this and want to really understand.
n 122240 2019 (GMT-04 00h 94 92 90 88 86 84 82 80 78 76 74 72 70 68 66 64 1000 1500 2000 2500 3000 3500 4000 Wavenumbers (cm-1) Date: Tue Jun 11 12:22:40 2019 (GMT-04:00kaoutar elbar Scans: 8 Resolution: 4.000 onemea1% RH 003 Q1L 129...
can
i please get help on identifying my unknown and answering the
questions for each part. and please explain because i will be given
an exam like this and want to really understand.
n 122240 2019 (GMT-04 00h 94 92 90 88 86 84 82 80 78 76 74 72 70 68 66 64 1000 1500 2000 2500 3000 3500 4000 Wavenumbers (cm-1) Date: Tue Jun 11 12:22:40 2019 (GMT-04:00kaoutar elbar Scans: 8 Resolution: 4.000 onemea1% RH 003 Q1L 129...
the way this is worded confuses me. Will there be one problem where male weight is x and female bmi is y. or is it two problems where x&y is male weight and bmi for the 1st problem, and x&y i...
 the way this is worded confuses me. Will there be one problem
where male weight is x and female bmi is y. or is it two problems
where x&y is male weight and bmi for the 1st problem, and
x&y is female weight and bmi for problem 2?
2. Using the data set of the Health Exam Results, conduct the following of weight (WT) and Index (BMI). Number the data set from 1 to 40, and select the following individuals:...
the way this is worded confuses me. Will there be one problem
where male weight is x and female bmi is y. or is it two problems
where x&y is male weight and bmi for the 1st problem, and
x&y is female weight and bmi for problem 2?
2. Using the data set of the Health Exam Results, conduct the following of weight (WT) and Index (BMI). Number the data set from 1 to 40, and select the following individuals:...
Complete the following four hypotheses, using α = 0.05 for each. The week 5 spreadsheet can...
Complete the following four hypotheses, using α = 0.05 for each. The week 5 spreadsheet can be used in these analyses. 1. Mean sales per week exceed 42.5 per salesperson 2. Proportion receiving online training is less than 55% 3 Mean calls made among those with no training is at least 145 4. Mean time per call is 14.7 minutes Using the same data set from part A, perform the hypothesis test for each speculation in order to see if...
 The following data represents the number of consecutive minutes (to the nearest minute) 2. spent on mobile phones by students attending the University of A. 23 2 26 40 22 52 28 40 19 55 50 52 51 46 51 60 59 45 26 2 48 1 34 10 18 45 29 41 11 43 50 32 37 15 57 17 57 35 50 45 7 22 15 13 20 13 15 32 13 39 25 38 31 16 7...
 1. Forecast demand for Year 4.
a. Explain what technique you utilized to forecast your
demand.
b. Explain why you chose this technique over others.
Year 3 Year 1 Year 2 Actual Actual Actual Forecast Forecast Forecast Demand Demand Demand Week 1 52 57 63 55 66 77 Week 2 49 58 68 69 75 65 Week 3 47 50 58 65 80 74 Week 4 60 53 58 55 78 67 57 Week 5 49 57 64 76 77...
1. Forecast demand for Year 4.
a. Explain what technique you utilized to forecast your
demand.
b. Explain why you chose this technique over others.
Year 3 Year 1 Year 2 Actual Actual Actual Forecast Forecast Forecast Demand Demand Demand Week 1 52 57 63 55 66 77 Week 2 49 58 68 69 75 65 Week 3 47 50 58 65 80 74 Week 4 60 53 58 55 78 67 57 Week 5 49 57 64 76 77...
 Question 1: Compute the linear regression
equation (coefficients) between the “year” variable and the
“temperature” variable. In other words, the dependent variable will
be the temperature and the independent variable will be “year”
variable. Write down the equation, the correlation coefficient
R and the standard error.
Question 2.
a. Has the annual temperature trend given by
the regression line increased or decreased? Hint: Which of the
regression line coefficients expresses whether the linear
relationship between temperature and time (in years)...
Question 1: Compute the linear regression
equation (coefficients) between the “year” variable and the
“temperature” variable. In other words, the dependent variable will
be the temperature and the independent variable will be “year”
variable. Write down the equation, the correlation coefficient
R and the standard error.
Question 2.
a. Has the annual temperature trend given by
the regression line increased or decreased? Hint: Which of the
regression line coefficients expresses whether the linear
relationship between temperature and time (in years)...
 can
i please get help on identifying my unknown and answering the
questions for each part. and please explain because i will be given
an exam like this and want to really understand.
n 122240 2019 (GMT-04 00h 94 92 90 88 86 84 82 80 78 76 74 72 70 68 66 64 1000 1500 2000 2500 3000 3500 4000 Wavenumbers (cm-1) Date: Tue Jun 11 12:22:40 2019 (GMT-04:00kaoutar elbar Scans: 8 Resolution: 4.000 onemea1% RH 003 Q1L 129...
can
i please get help on identifying my unknown and answering the
questions for each part. and please explain because i will be given
an exam like this and want to really understand.
n 122240 2019 (GMT-04 00h 94 92 90 88 86 84 82 80 78 76 74 72 70 68 66 64 1000 1500 2000 2500 3000 3500 4000 Wavenumbers (cm-1) Date: Tue Jun 11 12:22:40 2019 (GMT-04:00kaoutar elbar Scans: 8 Resolution: 4.000 onemea1% RH 003 Q1L 129...
 the way this is worded confuses me. Will there be one problem
where male weight is x and female bmi is y. or is it two problems
where x&y is male weight and bmi for the 1st problem, and
x&y is female weight and bmi for problem 2?
2. Using the data set of the Health Exam Results, conduct the following of weight (WT) and Index (BMI). Number the data set from 1 to 40, and select the following individuals:...
the way this is worded confuses me. Will there be one problem
where male weight is x and female bmi is y. or is it two problems
where x&y is male weight and bmi for the 1st problem, and
x&y is female weight and bmi for problem 2?
2. Using the data set of the Health Exam Results, conduct the following of weight (WT) and Index (BMI). Number the data set from 1 to 40, and select the following individuals:...
Most questions answered within 3 hours.
-
Where is the error in this code sequence?
String s1 = "Hello";
String s2 = "ello";...
asked 10 months ago -
Financial data for Joel de Paris, Inc., for last year
follow:
Joel de Paris, Inc.
Balance...
asked 10 months ago -
Consider this reaction:
Al2(SO4)3 (aq)+ BaCl3
(aq) Al2Cl6 (aq)- +
3BaSO4(s) . What is the...
asked 10 months ago -
Suppose that Savneet is considering increasing her
recent random sample from 20 car rentals to 40...
asked 10 months ago -
Trucks arrive at an unloading terminal at an average rate of 120
per hour.
Trucks arrive...
asked 10 months ago -
Why are methanol and ethanol completely soluble in water while
octanol is not very little soluble....
asked 10 months ago -
A facilities manager at a university reads in a research report
that the mean amount of...
asked 10 months ago -
When the CuSO4 is rehydrated by adding water to the anhydrous
compound, is this an endothermic...
asked 10 months ago -
A ray of sunlight is passing from diamond into crown glass; the
angle of incidence is...
asked 10 months ago -
A block of mass 0.249 kg is placed on top of a light, vertical
spring of...
asked 10 months ago -
how do the kidneys compensate in the presences of acidosis
a) trigger hyperventilate
b) reserve acid...
asked 10 months ago -
Question 501 pts
The rental rate of capital to the firm increases. Which of the
following...
asked 10 months ago