Solve for H(s) and plot the magnitude and phase of that function in MATLAB. Make sure to use the freqs() command when doing so.

Please include all the steps and add comments to the code to help me understand the problem. Thank you
Homework Answers
Hello,
Please find the answer
attached below. If the answer has helped you please give a
thumbs up rating. Thank you and have a nice
day!
********** Matlab Code************
%%%%%%%%%%%%%%%%%%%%%%%%%%%%%%%%%
%% transfer function derivation
s = tf([1 0],1); %
transfer function s
z1 = (1/s) + 1; %
impedance of R and C in series
z2 =
1/s;
% impedance of C
z = (z1*z2)/(z1+z2); % z1 and z2 in
parallel
clc;
h1 =
z/(z+1)
% voltage division between R and z
num = [1 3 2 0 0 0 0 0];
den = [1 5 7 2 0 0 0 0 0];
w = logspace(-2,4);
freqs(num,den,w)
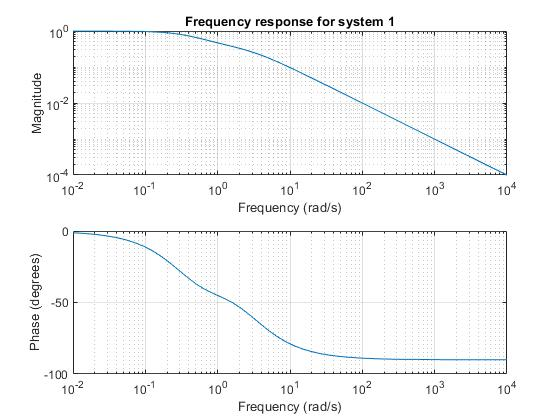
title('Frequency response for system 1');
%%%%%%%%%%%% sys 2
figure;
z1 = 1 + s; % R + L in series
z2 = 1; % R=1
z = (z1*z2)/(z1+z2); % z1 and z2 in
parallel
h2 =
z/(s+z)
% voltage division between L and z
num = [1 3 2];
den = [1 5 7 2];
freqs(num,den,w)
title('Frequency response for system 2');
************** End of Code ************
Output:
h1 =
s^7 + 3 s^6 + 2 s^5
---------------------------
s^8 + 5 s^7 + 7 s^6 + 2 s^5
Continuous-time transfer function.
h2 =
s^2 + 3 s + 2
---------------------
s^3 + 5 s^2 + 7 s + 2
Continuous-time transfer function.
NOTE: You can see that both the transfer functions are the same (cancellation). Thus, we get two similar frequency responses:

**************************************************************
PS: Please do not forget the thumbs up!!
Add Answer to:
Solve for H(s) and plot the magnitude and phase of that function
in MATLAB. Make sure...
Using Matlab, plot the magnitude and phase of the transfer function (vo/vi) vs. frequency range 1-100...
 Using Matlab, plot the magnitude and phase of the transfer
function (vo/vi) vs. frequency range 1-100 kHz. Use log scale for
the frequency axis, dB scale for the magnitude axis, and degrees
for the phase axis. Note dB = 20log10(vo/vi). The 10 stands for
base 10. I need help writing a MATLAB code to output this plot and
also coming up with the vo/vi function itself.
0.1807 H 1402 nF 0.1624 H 1.560nF 1.559 mH
Using Matlab, plot the magnitude and phase of the transfer
function (vo/vi) vs. frequency range 1-100 kHz. Use log scale for
the frequency axis, dB scale for the magnitude axis, and degrees
for the phase axis. Note dB = 20log10(vo/vi). The 10 stands for
base 10. I need help writing a MATLAB code to output this plot and
also coming up with the vo/vi function itself.
0.1807 H 1402 nF 0.1624 H 1.560nF 1.559 mH
Solve h(s) =v0/vs for the following circuits. And plot the magnitude and phase in matlab(I need...
 Solve h(s) =v0/vs for the following circuits. And plot the
magnitude and phase in matlab(I need the codes) thanks in advance.
ST.66. 1 F ΙΩ 1 H 1S2 ΙΩ e 14.88 ob. 14.57
Solve h(s) =v0/vs for the following circuits. And plot the
magnitude and phase in matlab(I need the codes) thanks in advance.
ST.66. 1 F ΙΩ 1 H 1S2 ΙΩ e 14.88 ob. 14.57
4s +1 2s2 +13s 20 H(s) = 1- Use MATLAB to plot the magnitude and phase...
 4s +1 2s2 +13s 20 H(s) = 1- Use MATLAB to plot the magnitude and phase responses of this filter. Label 2- What is the type of this filter type (lowpass, highpass, bandpass,.. .? Plcase 3- Derive the partial fraction expansion of H(s) using the residue command in 4- Determine the impulse response h(t) of the system and plot it using MATLAB. the axes completely. explain. MATLAB and write the expression.
7 11. If a particular network is described by transfer function H(s), use MATLAB to plot the magnitude and phase Bode plot for H(s) equal to (a) 300 (s2 7s +7 s(5s +8s(2s + 4) 7 11. If a particu...
 7 11. If a particular network is described by transfer function H(s), use MATLAB to plot the magnitude and phase Bode plot for H(s) equal to (a) 300 (s2 7s +7 s(5s +8s(2s + 4)
7 11. If a particular network is described by transfer function H(s), use MATLAB to plot the magnitude and phase Bode plot for H(s) equal to (a) 300 (s2 7s +7 s(5s +8s(2s + 4)
7 11. If a particular network is described by transfer function H(s), use MATLAB to plot the magnitude and phase Bode plot for H(s) equal to (a) 300 (s2 7s +7 s(5s +8s(2s + 4)
CODE the Rosenbrock function, its gradient and Hessian separately in your MATLAB. Make sure that those...
CODE the Rosenbrock function, its gradient and Hessian separately in your MATLAB. Make sure that those functions can be called as a subroutine or function. Make sture that those functions can Plot the Rosebrock function including the minimizer and plot the contour Rosenbrock function f(x) = 100(x2- 2 + (1-x1)^2 The function is worked out here: https://www.chegg.com/homework-help/questions-and-answers/code-rosenbrock-function-fro-h-gradient-hessian-sepa-rately-matlab-python-orjuia-make-sure-q34582359 However I would like to see it coded in MATLAB please! Thanks
3. Draw the Bode plot (magnitude and phase) for the transfer function H(s) of a CT...
 3. Draw the Bode plot (magnitude and phase) for the transfer function H(s) of a CT LTI given by H(s) 4000 only the asymptotic plot of the terms that make up the transfer function but also show the composite plot that adds all the terms that make up the transfer function. S+2000s+10 where the ROC includes the ja axis. Show
For each of the transfer functions given below, draw the pole-zero plot and plot the magnitude separate from the phase as a function of frequency. Show only the asymptotic terms that make up the tra...
 For each of the transfer functions given below, draw the pole-zero plot and plot the magnitude separate from the phase as a function of frequency. Show only the asymptotic terms that make up the transfer function and then add them to show the composite plot. You can verify your plots (to some extent) by using MATLAB to generate the plots but only as a check that the work you have done is correct. The work that will count for points...
alpha = 5.0 beta = 7.1 zeta = 6.9 PROBLEM 1 (20 points). Given the filter with transfer function +28-1+-2 11(2) = 1-(α/10)2-4 (a2/100):-2 Use MATLAB to Find the zeros and poles of H() Plot the pole...
 alpha = 5.0
beta = 7.1
zeta = 6.9
PROBLEM 1 (20 points). Given the filter with transfer function +28-1+-2 11(2) = 1-(α/10)2-4 (a2/100):-2 Use MATLAB to Find the zeros and poles of H() Plot the poles and zeros on the -plane. The pot should include the uit circle. Plot the magnitude response (in dB) Plot the phase response. Deliverables: Your MATLAB code used to solve Problem 1 and all the generated plots.
PROBLEM 1 (20 points). Given the filter...
alpha = 5.0
beta = 7.1
zeta = 6.9
PROBLEM 1 (20 points). Given the filter with transfer function +28-1+-2 11(2) = 1-(α/10)2-4 (a2/100):-2 Use MATLAB to Find the zeros and poles of H() Plot the poles and zeros on the -plane. The pot should include the uit circle. Plot the magnitude response (in dB) Plot the phase response. Deliverables: Your MATLAB code used to solve Problem 1 and all the generated plots.
PROBLEM 1 (20 points). Given the filter...
I'm not sure how to use plot to display the mag of the amplitude .Generate Bode...
 I'm not sure how to use plot to display the mag of the
amplitude
.Generate Bode Plot for following frequency response system using MATLAB Can you guess MATLAB function which generate Bode Plot? Repeat (No 8), but this time use this function to plot amplitude and phase response of system . Use help in MATLAB to find the syntax for function. Include screen shot of your code and results in report. H(s) = s
I'm not sure how to use plot to display the mag of the
amplitude
.Generate Bode Plot for following frequency response system using MATLAB Can you guess MATLAB function which generate Bode Plot? Repeat (No 8), but this time use this function to plot amplitude and phase response of system . Use help in MATLAB to find the syntax for function. Include screen shot of your code and results in report. H(s) = s
Find the transfer function H(s) for the circuit below. Make s=jw and plot the Bode plot...
 Find the transfer function H(s) for the circuit below. Make s=jw
and plot the Bode plot (magnitude and phase response) for the
transfer function.
C = out 페
Find the transfer function H(s) for the circuit below. Make s=jw
and plot the Bode plot (magnitude and phase response) for the
transfer function.
C = out 페
 Using Matlab, plot the magnitude and phase of the transfer
function (vo/vi) vs. frequency range 1-100 kHz. Use log scale for
the frequency axis, dB scale for the magnitude axis, and degrees
for the phase axis. Note dB = 20log10(vo/vi). The 10 stands for
base 10. I need help writing a MATLAB code to output this plot and
also coming up with the vo/vi function itself.
0.1807 H 1402 nF 0.1624 H 1.560nF 1.559 mH
Using Matlab, plot the magnitude and phase of the transfer
function (vo/vi) vs. frequency range 1-100 kHz. Use log scale for
the frequency axis, dB scale for the magnitude axis, and degrees
for the phase axis. Note dB = 20log10(vo/vi). The 10 stands for
base 10. I need help writing a MATLAB code to output this plot and
also coming up with the vo/vi function itself.
0.1807 H 1402 nF 0.1624 H 1.560nF 1.559 mH
 Solve h(s) =v0/vs for the following circuits. And plot the
magnitude and phase in matlab(I need the codes) thanks in advance.
ST.66. 1 F ΙΩ 1 H 1S2 ΙΩ e 14.88 ob. 14.57
Solve h(s) =v0/vs for the following circuits. And plot the
magnitude and phase in matlab(I need the codes) thanks in advance.
ST.66. 1 F ΙΩ 1 H 1S2 ΙΩ e 14.88 ob. 14.57
 4s +1 2s2 +13s 20 H(s) = 1- Use MATLAB to plot the magnitude and phase responses of this filter. Label 2- What is the type of this filter type (lowpass, highpass, bandpass,.. .? Plcase 3- Derive the partial fraction expansion of H(s) using the residue command in 4- Determine the impulse response h(t) of the system and plot it using MATLAB. the axes completely. explain. MATLAB and write the expression.
 7 11. If a particular network is described by transfer function H(s), use MATLAB to plot the magnitude and phase Bode plot for H(s) equal to (a) 300 (s2 7s +7 s(5s +8s(2s + 4)
7 11. If a particular network is described by transfer function H(s), use MATLAB to plot the magnitude and phase Bode plot for H(s) equal to (a) 300 (s2 7s +7 s(5s +8s(2s + 4)
7 11. If a particular network is described by transfer function H(s), use MATLAB to plot the magnitude and phase Bode plot for H(s) equal to (a) 300 (s2 7s +7 s(5s +8s(2s + 4)
 3. Draw the Bode plot (magnitude and phase) for the transfer function H(s) of a CT LTI given by H(s) 4000 only the asymptotic plot of the terms that make up the transfer function but also show the composite plot that adds all the terms that make up the transfer function. S+2000s+10 where the ROC includes the ja axis. Show
 For each of the transfer functions given below, draw the pole-zero plot and plot the magnitude separate from the phase as a function of frequency. Show only the asymptotic terms that make up the transfer function and then add them to show the composite plot. You can verify your plots (to some extent) by using MATLAB to generate the plots but only as a check that the work you have done is correct. The work that will count for points...
 alpha = 5.0
beta = 7.1
zeta = 6.9
PROBLEM 1 (20 points). Given the filter with transfer function +28-1+-2 11(2) = 1-(α/10)2-4 (a2/100):-2 Use MATLAB to Find the zeros and poles of H() Plot the poles and zeros on the -plane. The pot should include the uit circle. Plot the magnitude response (in dB) Plot the phase response. Deliverables: Your MATLAB code used to solve Problem 1 and all the generated plots.
PROBLEM 1 (20 points). Given the filter...
alpha = 5.0
beta = 7.1
zeta = 6.9
PROBLEM 1 (20 points). Given the filter with transfer function +28-1+-2 11(2) = 1-(α/10)2-4 (a2/100):-2 Use MATLAB to Find the zeros and poles of H() Plot the poles and zeros on the -plane. The pot should include the uit circle. Plot the magnitude response (in dB) Plot the phase response. Deliverables: Your MATLAB code used to solve Problem 1 and all the generated plots.
PROBLEM 1 (20 points). Given the filter...
 I'm not sure how to use plot to display the mag of the
amplitude
.Generate Bode Plot for following frequency response system using MATLAB Can you guess MATLAB function which generate Bode Plot? Repeat (No 8), but this time use this function to plot amplitude and phase response of system . Use help in MATLAB to find the syntax for function. Include screen shot of your code and results in report. H(s) = s
I'm not sure how to use plot to display the mag of the
amplitude
.Generate Bode Plot for following frequency response system using MATLAB Can you guess MATLAB function which generate Bode Plot? Repeat (No 8), but this time use this function to plot amplitude and phase response of system . Use help in MATLAB to find the syntax for function. Include screen shot of your code and results in report. H(s) = s
 Find the transfer function H(s) for the circuit below. Make s=jw
and plot the Bode plot (magnitude and phase response) for the
transfer function.
C = out 페
Find the transfer function H(s) for the circuit below. Make s=jw
and plot the Bode plot (magnitude and phase response) for the
transfer function.
C = out 페
Most questions answered within 3 hours.
-
Where is the error in this code sequence?
String s1 = "Hello";
String s2 = "ello";...
asked 10 months ago -
Financial data for Joel de Paris, Inc., for last year
follow:
Joel de Paris, Inc.
Balance...
asked 10 months ago -
Consider this reaction:
Al2(SO4)3 (aq)+ BaCl3
(aq) Al2Cl6 (aq)- +
3BaSO4(s) . What is the...
asked 10 months ago -
Suppose that Savneet is considering increasing her
recent random sample from 20 car rentals to 40...
asked 10 months ago -
Trucks arrive at an unloading terminal at an average rate of 120
per hour.
Trucks arrive...
asked 10 months ago -
Why are methanol and ethanol completely soluble in water while
octanol is not very little soluble....
asked 10 months ago -
A facilities manager at a university reads in a research report
that the mean amount of...
asked 10 months ago -
When the CuSO4 is rehydrated by adding water to the anhydrous
compound, is this an endothermic...
asked 10 months ago -
A ray of sunlight is passing from diamond into crown glass; the
angle of incidence is...
asked 10 months ago -
A block of mass 0.249 kg is placed on top of a light, vertical
spring of...
asked 10 months ago -
how do the kidneys compensate in the presences of acidosis
a) trigger hyperventilate
b) reserve acid...
asked 10 months ago -
Question 501 pts
The rental rate of capital to the firm increases. Which of the
following...
asked 10 months ago