FIREARM DEATHS Download the Excel file Firearm.xls for use in
this question. The number of deaths due to firearms in the United
States between 1968 and 1993 are given in the Excel file.
Answer the following using the research hypothesis, "there is a
correlation between year and number of firearm deaths in the
US."
- A. What is the value of the correlation coefficient between year and number of firearm deaths? (Answer to 3 decimal places)
- B. How many degrees of freedom does your data have?
- C. What is the critical value of your test statistic?
- D. Is there evidence of a significant trend in firearm deaths over this period? (yes/no)

- I submitted this test a few times but I keep getting different answers now I'm so confused I don't even know what to study can I get an expert on this please. Thanks

Homework Answers
Let's find out the correlation coefficient in Microsoft Excel. Go to Data -> Data Analysis -> Correlation. Now input the following into the dialog box and click OK.
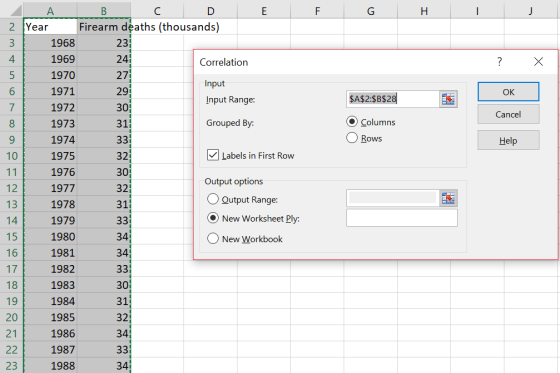
After you are done, we will get the output for the correlation coefficient.
| Year | Firearm deaths (thousands) | |
| Year | 1 | |
| Firearm deaths (thousands) | 0.859751 | 1 |
a) Correlation coefficient = 0.860
b) Degrees of freedom = n - 2 = 26 - 2 = 24
c) Let's find out the critical value of the chi-square statistic at df = 24 and alpha = 0.05 (assume) from the table.
Critical value = 0.381
d) As the correlation coefficient = 0.860 > 0.381, there is evidence of a significant trend in firearm deaths over this period. Answer is YES
Add Answer to:
FIREARM DEATHS Download the Excel file Firearm.xls for use in
this question. The number of deaths...
~~~~~~~~~~~~TO BE COMPLETED USING RSTUDIO~~~~~~~~~~~~~~ ~~~~~~~~~~~~(Please display all RCode used)~~~~~~~~~~~~~~ Regression Is there a relationship between...
~~~~~~~~~~~~TO BE COMPLETED USING RSTUDIO~~~~~~~~~~~~~~ ~~~~~~~~~~~~(Please display all RCode used)~~~~~~~~~~~~~~ Regression Is there a relationship between the number of stories a building has and its height? Some statisticians compiled data on a set of n = 60 buildings reported in the World Almanac. You will use the data set to decide whether height (in feet) can be predicted from the number of stories. (a) Load the data from buildings.txt. (Note that this is a text file, so use the appropriate...
Use it and Excel to answer this question. It contains the United States Census Bureau’s estimates...
Use it and Excel to answer this question. It contains the United States Census Bureau’s estimates for World Population from 1950 to 2014. You will find a column of dates and a column of data on the World Population for these years. Generate the time variable t. Then run a regression with the Population data as a dependent variable and time as the dependent variable. Have Excel report the residuals. (a) (4 marks) Based on the ANOVA table and t-statistics,...
The precipitations in Sherbrooke have been recorded from 1962 to 2007 Total Precipitation 1132,7 1090,2 911,6...
 The precipitations in Sherbrooke have been recorded from 1962 to 2007 Total Precipitation 1132,7 1090,2 911,6 899,9 895,8 1311,5 1095,5 927 1196.3 295,3 1299.1 1155,3 1055,5 960,4 1051,7 1079 881,5 895,5 1173,5 1011 1184.6 1289 1188 Total Precipitation Year 1985 1986 1987 1988 1989 1990 1991 Year 1963 1964 1965 1966 1967 1968 1969 1970 1971 1972 1973 1974 1975 1976 1977 1978 1979 1980 1981 1982 1983 1984 952,7 943.2 854.1 944,5 969.6 1034,3 1088,5 247,7 1040,2 1153,6 1281,2...
The data set on the right contains the real per capita GDP for 2 countries from the Penn World Table (PWT) version 9.1 (Feenstra et al., 2015). The column names are the country codes, OMN and PSE. You may copy the dataset to Excel or R to do the computati
 YearOMN197011266197176221972632319735051197473381975802219768360197793611978965919791092719801149919811280319821276619831242319841306419851403219861019219871005419888809198992381990105911991991819921026319931004519949747199510199199611054199711784199811560199913501200016173200116853200218508200320329200425768200526647200638458200740960200847136200938538201040305201144477201247334201344979201440855201532460201629939201728249
PLEASE SOLVE USING EXCEL. PLEASE INCLUDE STEP BY STEP ON HOW TO SOLVE THIS QUESTION ON...
 PLEASE SOLVE USING EXCEL. PLEASE INCLUDE STEP BY STEP ON HOW TO
SOLVE THIS QUESTION ON EXCEL.. THANK YOU!!!!
1. DEVELOP SPREADSHEET MODELS FOR FORECASTING ATTENDANCE USING
SINGLE MOVING AVERAGE AND SINGLE EXPONENTIAL SMOOTHING.
(completed)
2. Using MAD, MSE, AND MAPE as guidance, find the best number of
moving average periods and best smoothing consant for exponential
smoothing.
PLEASE USE EXCEL TO SOLVE THIS QUESTION
N5 0San Francisco Giants (1958-1967 seasons) 4 Year Attendance1 Giants plus Oakland A's after A's...
PLEASE SOLVE USING EXCEL. PLEASE INCLUDE STEP BY STEP ON HOW TO
SOLVE THIS QUESTION ON EXCEL.. THANK YOU!!!!
1. DEVELOP SPREADSHEET MODELS FOR FORECASTING ATTENDANCE USING
SINGLE MOVING AVERAGE AND SINGLE EXPONENTIAL SMOOTHING.
(completed)
2. Using MAD, MSE, AND MAPE as guidance, find the best number of
moving average periods and best smoothing consant for exponential
smoothing.
PLEASE USE EXCEL TO SOLVE THIS QUESTION
N5 0San Francisco Giants (1958-1967 seasons) 4 Year Attendance1 Giants plus Oakland A's after A's...
**R-STUDIO KNOWLEDGE REQUIRED*** PLEASE ANSWER THE FOLLOWING WITH ****R-STUDIO**** CODING- thank ...
 **R-STUDIO KNOWLEDGE REQUIRED***
PLEASE ANSWER THE FOLLOWING WITH ****R-STUDIO****
CODING- thank you so much!!
I am specifically look for the solution to part
***(h)**** and *****(i)***** below using R-Studio
code:
The data set in question
is:
YEAR Height Stories
1990 770 54
1980 677 47
1990 428 28
1989 410 38
1966 371 29
1976 504 38
1974 1136 80
1991 695 52
1982 551 45
1986 550 40
1931 568 49
1979 504 33
1988 560 50
1973 512...
**R-STUDIO KNOWLEDGE REQUIRED***
PLEASE ANSWER THE FOLLOWING WITH ****R-STUDIO****
CODING- thank you so much!!
I am specifically look for the solution to part
***(h)**** and *****(i)***** below using R-Studio
code:
The data set in question
is:
YEAR Height Stories
1990 770 54
1980 677 47
1990 428 28
1989 410 38
1966 371 29
1976 504 38
1974 1136 80
1991 695 52
1982 551 45
1986 550 40
1931 568 49
1979 504 33
1988 560 50
1973 512...
11.14 The peak-flow data on an annual basis from Cedar River near Austin, MN, are listed...
 11.14 The peak-flow data on an annual basis from Cedar River near Austin, MN, are listed in the following table. Plot the flood-frequency curve on lognormal probability paper. Determine the (a) magnitude of a flood having a return period of 100 years (probability of 1%), and (b) probability of a flow of 100 cfs. Peak- flow cfs 7750 5440 Peak- flow cfs Peak- flow cfs Peak- flow cfs Year Year Year 1991 979 3880 2003 8690 1992 2004 3580 1993...
Please use excel to solve. Any help would be greatly appreciated. A B E F G...
 Please use excel to solve. Any
help would be greatly appreciated.
A B E F G 1 C D Changes in Consumer Price Index, 1960-2006 (Percent) 2 Year-Year Percent Change in Commodities CPI Year-Year Percent Change in Services CPI 3 4 5 6 7 8 Commodities% 0.9 Services% 3.4 0.6 1.7 9 10 11 12 13 14 15 16 17 18 19 20 21 22 23 24 25 26 27 28 29 30 31 32 33 34 35 36 37...
Please use excel to solve. Any
help would be greatly appreciated.
A B E F G 1 C D Changes in Consumer Price Index, 1960-2006 (Percent) 2 Year-Year Percent Change in Commodities CPI Year-Year Percent Change in Services CPI 3 4 5 6 7 8 Commodities% 0.9 Services% 3.4 0.6 1.7 9 10 11 12 13 14 15 16 17 18 19 20 21 22 23 24 25 26 27 28 29 30 31 32 33 34 35 36 37...
HYPOTHESIS TESTING Climate change is a topic of both academic and political interest. The Nationa...
HYPOTHESIS TESTING Climate change is a topic of both academic and political interest. The National Climatic Data Center has recorded temperature data since 1800. You can explore their data at: http://data.giss.nasa.gov/gistemp/ The following chart compares the average Land-Surface Air Temperatures for year since 1961 to the 20th century average Land-Surface Air Temperature. Year Temp Change, °C 1961 0.075 1962 0.038 1963 0.079 1964 -0.207 1965 -0.111 1966 -0.031 1967 -0.005 1968 -0.044 1969 0.076 1970 0.028 1971 -0.105 1972 0.001...
2.5. Here are data on the number of people bitten by alligators in Florida over a...
 2.5. Here are data on the number of people bitten by alligators in Florida over a 36-year period. Make two graphs of these data to illustrate why you should always make a time plot for data collected over time a) Make a histogram of the counts of people bitten by alligators. The distribution has an irregular shape What is the midpoint of the yearly counts of people bitten? b) Make a time plot. There is a great variation from year...
 The precipitations in Sherbrooke have been recorded from 1962 to 2007 Total Precipitation 1132,7 1090,2 911,6 899,9 895,8 1311,5 1095,5 927 1196.3 295,3 1299.1 1155,3 1055,5 960,4 1051,7 1079 881,5 895,5 1173,5 1011 1184.6 1289 1188 Total Precipitation Year 1985 1986 1987 1988 1989 1990 1991 Year 1963 1964 1965 1966 1967 1968 1969 1970 1971 1972 1973 1974 1975 1976 1977 1978 1979 1980 1981 1982 1983 1984 952,7 943.2 854.1 944,5 969.6 1034,3 1088,5 247,7 1040,2 1153,6 1281,2...
 PLEASE SOLVE USING EXCEL. PLEASE INCLUDE STEP BY STEP ON HOW TO
SOLVE THIS QUESTION ON EXCEL.. THANK YOU!!!!
1. DEVELOP SPREADSHEET MODELS FOR FORECASTING ATTENDANCE USING
SINGLE MOVING AVERAGE AND SINGLE EXPONENTIAL SMOOTHING.
(completed)
2. Using MAD, MSE, AND MAPE as guidance, find the best number of
moving average periods and best smoothing consant for exponential
smoothing.
PLEASE USE EXCEL TO SOLVE THIS QUESTION
N5 0San Francisco Giants (1958-1967 seasons) 4 Year Attendance1 Giants plus Oakland A's after A's...
PLEASE SOLVE USING EXCEL. PLEASE INCLUDE STEP BY STEP ON HOW TO
SOLVE THIS QUESTION ON EXCEL.. THANK YOU!!!!
1. DEVELOP SPREADSHEET MODELS FOR FORECASTING ATTENDANCE USING
SINGLE MOVING AVERAGE AND SINGLE EXPONENTIAL SMOOTHING.
(completed)
2. Using MAD, MSE, AND MAPE as guidance, find the best number of
moving average periods and best smoothing consant for exponential
smoothing.
PLEASE USE EXCEL TO SOLVE THIS QUESTION
N5 0San Francisco Giants (1958-1967 seasons) 4 Year Attendance1 Giants plus Oakland A's after A's...
 **R-STUDIO KNOWLEDGE REQUIRED***
PLEASE ANSWER THE FOLLOWING WITH ****R-STUDIO****
CODING- thank you so much!!
I am specifically look for the solution to part
***(h)**** and *****(i)***** below using R-Studio
code:
The data set in question
is:
YEAR Height Stories
1990 770 54
1980 677 47
1990 428 28
1989 410 38
1966 371 29
1976 504 38
1974 1136 80
1991 695 52
1982 551 45
1986 550 40
1931 568 49
1979 504 33
1988 560 50
1973 512...
**R-STUDIO KNOWLEDGE REQUIRED***
PLEASE ANSWER THE FOLLOWING WITH ****R-STUDIO****
CODING- thank you so much!!
I am specifically look for the solution to part
***(h)**** and *****(i)***** below using R-Studio
code:
The data set in question
is:
YEAR Height Stories
1990 770 54
1980 677 47
1990 428 28
1989 410 38
1966 371 29
1976 504 38
1974 1136 80
1991 695 52
1982 551 45
1986 550 40
1931 568 49
1979 504 33
1988 560 50
1973 512...
 11.14 The peak-flow data on an annual basis from Cedar River near Austin, MN, are listed in the following table. Plot the flood-frequency curve on lognormal probability paper. Determine the (a) magnitude of a flood having a return period of 100 years (probability of 1%), and (b) probability of a flow of 100 cfs. Peak- flow cfs 7750 5440 Peak- flow cfs Peak- flow cfs Peak- flow cfs Year Year Year 1991 979 3880 2003 8690 1992 2004 3580 1993...
 Please use excel to solve. Any
help would be greatly appreciated.
A B E F G 1 C D Changes in Consumer Price Index, 1960-2006 (Percent) 2 Year-Year Percent Change in Commodities CPI Year-Year Percent Change in Services CPI 3 4 5 6 7 8 Commodities% 0.9 Services% 3.4 0.6 1.7 9 10 11 12 13 14 15 16 17 18 19 20 21 22 23 24 25 26 27 28 29 30 31 32 33 34 35 36 37...
Please use excel to solve. Any
help would be greatly appreciated.
A B E F G 1 C D Changes in Consumer Price Index, 1960-2006 (Percent) 2 Year-Year Percent Change in Commodities CPI Year-Year Percent Change in Services CPI 3 4 5 6 7 8 Commodities% 0.9 Services% 3.4 0.6 1.7 9 10 11 12 13 14 15 16 17 18 19 20 21 22 23 24 25 26 27 28 29 30 31 32 33 34 35 36 37...
 2.5. Here are data on the number of people bitten by alligators in Florida over a 36-year period. Make two graphs of these data to illustrate why you should always make a time plot for data collected over time a) Make a histogram of the counts of people bitten by alligators. The distribution has an irregular shape What is the midpoint of the yearly counts of people bitten? b) Make a time plot. There is a great variation from year...
Most questions answered within 3 hours.
-
Where is the error in this code sequence?
String s1 = "Hello";
String s2 = "ello";...
asked 10 months ago -
Financial data for Joel de Paris, Inc., for last year
follow:
Joel de Paris, Inc.
Balance...
asked 10 months ago -
Consider this reaction:
Al2(SO4)3 (aq)+ BaCl3
(aq) Al2Cl6 (aq)- +
3BaSO4(s) . What is the...
asked 10 months ago -
Suppose that Savneet is considering increasing her
recent random sample from 20 car rentals to 40...
asked 10 months ago -
Trucks arrive at an unloading terminal at an average rate of 120
per hour.
Trucks arrive...
asked 10 months ago -
Why are methanol and ethanol completely soluble in water while
octanol is not very little soluble....
asked 10 months ago -
A facilities manager at a university reads in a research report
that the mean amount of...
asked 10 months ago -
When the CuSO4 is rehydrated by adding water to the anhydrous
compound, is this an endothermic...
asked 10 months ago -
A ray of sunlight is passing from diamond into crown glass; the
angle of incidence is...
asked 10 months ago -
A block of mass 0.249 kg is placed on top of a light, vertical
spring of...
asked 10 months ago -
how do the kidneys compensate in the presences of acidosis
a) trigger hyperventilate
b) reserve acid...
asked 10 months ago -
Question 501 pts
The rental rate of capital to the firm increases. Which of the
following...
asked 10 months ago