
Homework Answers

Add Answer to:
12.2.8. Do the following data appear to violate the as- sumptions underlying the analysis of variance?...
For the data listed(assume sample). a.) Find the following: Mean Mode Median Midrange Range Quartiles Variance...
For the data listed(assume sample). a.) Find the following: Mean Mode Median Midrange Range Quartiles Variance Standard Deviation BoxPlot b.) Create a frequency distribution When creating classes use the formula from the Notes on how classes to create. 17 23 14 16 12 26 20 22 14 15 22 18 18 21 21 19 15 21 18 17 15 25 14 30 16 10 20 12 16 17.44 16 14 15 20 20 16 17 16 15 15 19 48...
For each variable of interest, do the following: 1. Find the mean, five-number summary, range, variance,...
For each variable of interest, do the following: 1. Find the mean, five-number summary, range, variance, and standard deviation. Display these numbers in a format that is easy to understand. 2. For each variable of interest, use its five-number summary to construct a boxplot. Each boxplot must be constructed horizontally, and must be accompanied by a brief descriptive paragraph that assesses whether the data appear to be symmetrical, left-skewed, or right-skewed. Construct a 95% confidence interval for the mean μ...
Calculate the pooled variance (as in an independent-Measures t test for the following sample. Round to...
 Calculate the pooled variance (as in an independent-Measures t test for the following sample. Round to two decimal places. Treatment Treatment A B 12 8 8 9 12 15 16 17 4 5 17 18 17 13 6 3
Consider the following data. 14 21 23 20 16 19 22 26 15 16 23 25...
Consider the following data. 14 21 23 20 16 19 22 26 15 16 23 25 24 20 15 20 19 20 21 13 17 17 18 23 26 21 22 15 20 18 25 24 15 23 25 19 21 24 21 19 (a) Develop a frequency distribution using classes of 12–14, 15–17, 18–20, 21–23, and 24–26. Class Frequency 12–14 15–17 18–20 21–23 24–26 Total (b) Develop a relative frequency distribution and a percent frequency distribution using the classes...
Consider the data in the following frequency distribution. Assume the data represent a sample. Class Frequency...
Consider the data in the following frequency distribution. Assume the data represent a sample. Class Frequency 12-16 12 17-21 23 22-26 14 27-31 21 What is the variance?
The following is data for the first and second Quiz scores for 8 students in a...
 The following is data for the first and second Quiz scores for 8 students in a class. First Quiz (Q1) Second Quiz (Q2) 12 14 11 17 17 18 21 21 22 23 22 25 21 24 26 Plot the boints in the grid below, then sketch a line that best fits the data. 152+ Q2 28 24 20- 16- 12 84 4- QI 24 28 12 16 20 Clear All Draw: Use the line above to predict the value...
Travel Data 10. Using your travel data: a. Develop a 95% confidence interval for your mean...
 Travel Data 10. Using your travel data: a. Develop a 95% confidence interval for your mean time to work (lunch) using time in minutes. b. What assumption is necessary for you to complete part (a)? Do you feel this assumption is valid? 119 B C A 1 TO WORK Time in Day of Week Minutes 2 Date Ce 2-Sep Monday 3-Sep Tuesday 4-Sep Wednesday 5-Sep Thursday 6-Sep Friday 9-Sep Monday 10-Sep Tuesday 11-Sep Wednesday 12-Sep Thursday 13-Sep Friday 16-Sep Monday...
The following data represent the results from an independent-measures experiment comparing three treatment conditions. Use a...
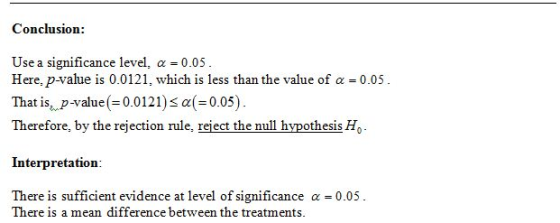
 The following data represent the results from an independent-measures experiment comparing three treatment conditions. Use a spreadsheet to conduct an analysis of variance with a = whether these data are sufficient to conclude that there are significant differences between the 0.05 to determine treatments. Treatment A Treatment B Treatment 19 22 24 20 20 25 20 19 26 20 21 22 21 23 28 F-ratio = p-value - Conclusion: There is a significant difference between treatments These data do not...
Game Point_Differential Assists Rebounds Turnovers Personal_Fouls 1 15 15 38 11 9 2 36 20 43 &
 Game
Point_Differential Assists
Rebounds Turnovers Personal_Fouls
1 15 15 38
11 9
2 36 20 43
8 13
3 16 21 29
7 13
4 45 22 46
11 11
5 12 11 40
7 22
6 -10 10 31
13 26
7 11 19 45
11 7
8 12 16 32
16 14
9 3 16 27
18 15
10 19 9 34
17 17
11 40 16 41
9 17
12 44 12 29
9 22
13 16 ...
Game
Point_Differential Assists
Rebounds Turnovers Personal_Fouls
1 15 15 38
11 9
2 36 20 43
8 13
3 16 21 29
7 13
4 45 22 46
11 11
5 12 11 40
7 22
6 -10 10 31
13 26
7 11 19 45
11 7
8 12 16 32
16 14
9 3 16 27
18 15
10 19 9 34
17 17
11 40 16 41
9 17
12 44 12 29
9 22
13 16 ...
Unit6: OPTIMIZING AND CONTROLLING PROCESSES THROUGH STATISTICAL PROCESS CONTROL 1. Define the concept of statistical process...
 Unit6: OPTIMIZING AND CONTROLLING PROCESSES THROUGH STATISTICAL
PROCESS CONTROL
1. Define the concept of statistical process control SPC?
2. What is SPC key element?
3. Solving the following problem (Using x -charts and R
–charts)?
a. Using this data to solve the problem by using X bar chart and
R chart?
b. What is the difference between X bar chart and R chart?
c. Draw the control chart for both X bar chart and R chart?
d. Explain the result?...
Unit6: OPTIMIZING AND CONTROLLING PROCESSES THROUGH STATISTICAL
PROCESS CONTROL
1. Define the concept of statistical process control SPC?
2. What is SPC key element?
3. Solving the following problem (Using x -charts and R
–charts)?
a. Using this data to solve the problem by using X bar chart and
R chart?
b. What is the difference between X bar chart and R chart?
c. Draw the control chart for both X bar chart and R chart?
d. Explain the result?...
 Calculate the pooled variance (as in an independent-Measures t test for the following sample. Round to two decimal places. Treatment Treatment A B 12 8 8 9 12 15 16 17 4 5 17 18 17 13 6 3
 The following is data for the first and second Quiz scores for 8 students in a class. First Quiz (Q1) Second Quiz (Q2) 12 14 11 17 17 18 21 21 22 23 22 25 21 24 26 Plot the boints in the grid below, then sketch a line that best fits the data. 152+ Q2 28 24 20- 16- 12 84 4- QI 24 28 12 16 20 Clear All Draw: Use the line above to predict the value...
 Travel Data 10. Using your travel data: a. Develop a 95% confidence interval for your mean time to work (lunch) using time in minutes. b. What assumption is necessary for you to complete part (a)? Do you feel this assumption is valid? 119 B C A 1 TO WORK Time in Day of Week Minutes 2 Date Ce 2-Sep Monday 3-Sep Tuesday 4-Sep Wednesday 5-Sep Thursday 6-Sep Friday 9-Sep Monday 10-Sep Tuesday 11-Sep Wednesday 12-Sep Thursday 13-Sep Friday 16-Sep Monday...
 The following data represent the results from an independent-measures experiment comparing three treatment conditions. Use a spreadsheet to conduct an analysis of variance with a = whether these data are sufficient to conclude that there are significant differences between the 0.05 to determine treatments. Treatment A Treatment B Treatment 19 22 24 20 20 25 20 19 26 20 21 22 21 23 28 F-ratio = p-value - Conclusion: There is a significant difference between treatments These data do not...
 Game
Point_Differential Assists
Rebounds Turnovers Personal_Fouls
1 15 15 38
11 9
2 36 20 43
8 13
3 16 21 29
7 13
4 45 22 46
11 11
5 12 11 40
7 22
6 -10 10 31
13 26
7 11 19 45
11 7
8 12 16 32
16 14
9 3 16 27
18 15
10 19 9 34
17 17
11 40 16 41
9 17
12 44 12 29
9 22
13 16 ...
Game
Point_Differential Assists
Rebounds Turnovers Personal_Fouls
1 15 15 38
11 9
2 36 20 43
8 13
3 16 21 29
7 13
4 45 22 46
11 11
5 12 11 40
7 22
6 -10 10 31
13 26
7 11 19 45
11 7
8 12 16 32
16 14
9 3 16 27
18 15
10 19 9 34
17 17
11 40 16 41
9 17
12 44 12 29
9 22
13 16 ...
 Unit6: OPTIMIZING AND CONTROLLING PROCESSES THROUGH STATISTICAL
PROCESS CONTROL
1. Define the concept of statistical process control SPC?
2. What is SPC key element?
3. Solving the following problem (Using x -charts and R
–charts)?
a. Using this data to solve the problem by using X bar chart and
R chart?
b. What is the difference between X bar chart and R chart?
c. Draw the control chart for both X bar chart and R chart?
d. Explain the result?...
Unit6: OPTIMIZING AND CONTROLLING PROCESSES THROUGH STATISTICAL
PROCESS CONTROL
1. Define the concept of statistical process control SPC?
2. What is SPC key element?
3. Solving the following problem (Using x -charts and R
–charts)?
a. Using this data to solve the problem by using X bar chart and
R chart?
b. What is the difference between X bar chart and R chart?
c. Draw the control chart for both X bar chart and R chart?
d. Explain the result?...
Most questions answered within 3 hours.
-
Where is the error in this code sequence?
String s1 = "Hello";
String s2 = "ello";...
asked 10 months ago -
Financial data for Joel de Paris, Inc., for last year
follow:
Joel de Paris, Inc.
Balance...
asked 10 months ago -
Consider this reaction:
Al2(SO4)3 (aq)+ BaCl3
(aq) Al2Cl6 (aq)- +
3BaSO4(s) . What is the...
asked 10 months ago -
Suppose that Savneet is considering increasing her
recent random sample from 20 car rentals to 40...
asked 10 months ago -
Trucks arrive at an unloading terminal at an average rate of 120
per hour.
Trucks arrive...
asked 10 months ago -
Why are methanol and ethanol completely soluble in water while
octanol is not very little soluble....
asked 10 months ago -
A facilities manager at a university reads in a research report
that the mean amount of...
asked 10 months ago -
When the CuSO4 is rehydrated by adding water to the anhydrous
compound, is this an endothermic...
asked 10 months ago -
A ray of sunlight is passing from diamond into crown glass; the
angle of incidence is...
asked 10 months ago -
A block of mass 0.249 kg is placed on top of a light, vertical
spring of...
asked 10 months ago -
how do the kidneys compensate in the presences of acidosis
a) trigger hyperventilate
b) reserve acid...
asked 10 months ago -
Question 501 pts
The rental rate of capital to the firm increases. Which of the
following...
asked 10 months ago