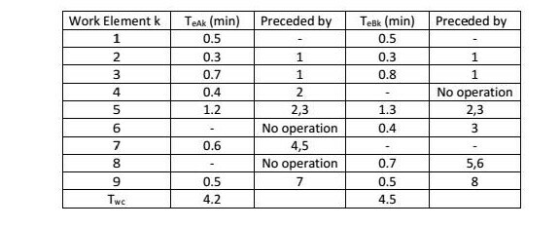
the elements together with the predecessor and
processing time of two models A and B are shown in table below.
hourly production rate of model a and b are 25 units/hr and 18
units/hr. assume E=1.0, Er=1.0 and M=1.
a) draw the precedence diagram for each model and both models
b) find the theoretical number of workstation needed to achieve the
required production rate.
c) use K-W method to solve the line balancing problem
d) determine the balance efficiency for your solution in (c)
e) determine the fixed rate launching interval and fixed rate
sequence
Homework Answers
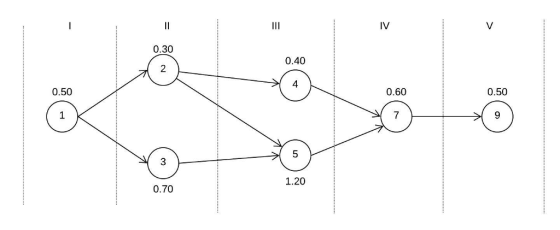
(a) The precedence diagram of both the models is as shown below:
Model 1
Model 2
 b)
find the theoretical number of workstation needed to achieve the
required production rate.
b)
find the theoretical number of workstation needed to achieve the
required production rate.
Cycle time = Time available / number of units to be produced
Number of theoretical workstations required = Total time required to produce one unit of a product / Cycle time
For Model 1
Cycle time = 60/25 = 2.4min
Number of theoretical workstations required = 4.2/2.4 = 1.75 ~ 2(Rounded Up)
Hence the number of theoretical workstations required = 2 workstations.
For Model 2
Cycle time = 60/18 = 3.3min
Number of theoretical workstations required = 4.5/3.3 = 1.35 ~ 2(Rounded Up)
Hence the number of theoretical workstations required = 2 workstations.
c) use K-W method to solve the line balancing problem
The procedure to solve the line
balancing problem by Kilbridge and Wester method
is as follows:
Step 1. Construct the precedence diagram, so
those nodes representing work elements of
identical precedence
are arranged vertically in columns.
Step 2. List the elements in order of their columns, column
I at the top of the list. If an element
can be located
in more than one column, list all columns by the
element to show the transferability of the
element.
Step 3. To assign elements to workstations, start with the
column I elements. Continue the
assignment
procedure in order of column number until the cycle time is
reached (T).
For Model 1
Step 1. Construct the precedence diagram, so those nodes
representing work elements of identical precedence
are arranged vertically in columns.
Step 2. List the elements in order of their columns, column I at the top of the list. If an element can be located in more than one column, list all columns by the element to show the transferability of the element.
| Work Element | Column | T(mins) | Preceded by |
| 1 | 1 | 0.5 | - |
| 2 | 2 | 0.3 | 1 |
| 3 | 2 | 0.7 | 1 |
| 4 | 3 | 0.4 | 2 |
| 5 | 3 | 1.2 | 2,3 |
| 7 | 4 | 0.6 | 4,5 |
| 9 | 5 | 0.5 | 7 |
Step 3. To assign elements to workstations, start with
the column I elements. Continue the assignment
procedure in order of column number until the cycle time is reached
(T).
| Work station | Work Element | Column | T(mins) | Preceded by | Station time |
| 1 | 1 | 1 | 0.5 | - | 1.9 |
| 2 | 2 | 0.3 | 1 | ||
| 3 | 2 | 0.7 | 1 | ||
| 4 | 3 | 0.4 | 2 | ||
| 2 | 5 | 3 | 1.2 | 2,3 | 2.3 |
| 7 | 4 | 0.6 | 4,5 | ||
| 9 | 5 | 0.5 | 7 |
For Model 2
Step 1. Construct the precedence diagram so those nodes
representing work elements of identical precedence
are arranged vertically in columns.
Step 2. List the elements in order of their columns,
column I at the top of the list. If an element can be located
in more than one column, list all columns by the element to show
the transferability of the element.
| Work Element | Column | T(mins) | Preceded by |
| 1 | 1 | 0.5 | - |
| 2 | 2 | 0.3 | 1 |
| 3 | 2 | o.8 | 1 |
| 5 | 3 | 1.3 | 2,3 |
| 6 | 3 | 0.4 | 3 |
| 8 | 4 | 0.7 | 5,6 |
| 9 | 5 | 0.9 | 7 |
Step 3. To assign elements to workstations, start with
the column I elements. Continue the assignment
procedure in order of column number until the cycle time is reached
(T).
| Work station | Work Element | Column | T(mins) | Preceded by | Station time |
| 1 | 1 | 1 | 0.5 | - | 3.2 |
| 2 | 2 | 0.3 | 1 | ||
| 3 | 2 | o.8 | 1 | ||
| 5 | 3 | 1.3 | 2,3 | ||
| 6 | 3 | 0.4 | 3 | ||
| 8 | 4 | 0.7 | 5,6 | ||
| 2 | 9 | 5 | 0.9 | 7 | 0.9 |
(d) determine the balance efficiency for your solution in (c)
Balance delay is a measure of the line inefficiency which results from idle time due to an imperfect allocation of work among stations. The percentage representation of line efficiency is called as balance efficiency given by formula as below.
Balance line efficiency = 
For Model 1

For Model 2

Add Answer to:
the elements together with the predecessor and
processing time of two models A and B are...
Task Time Predecessor 1 0.2 - 2 0.4 1 3 0.1 1 4 0.4 2,3 5...
Task Time Predecessor 1 0.2 - 2 0.4 1 3 0.1 1 4 0.4 2,3 5 0.1 2 6 0.3 3,4 7 0.2 5 8 0.2 5,6 9 0.4 7,8 Consider the operations given in Table 1. 47 feet of the oor space along the conveyor is available for installing assembly stations around a closed loop conveyor system. Eeach station is made 6 feet long in order for the operators to work comfortably, and at least 1 feet clearance between...
4.22 The table below lists the work elements in minutes to be performed on assembly line...
 4.22 The table below lists the work elements in minutes to be performed on assembly line with precedence requirements. Annual demand is 60000 units. The line will operate on shift (2000 hr/yr). Line efficiency is expected 95% and repositioning time is 6 sec. The table below defines the precedence relationships and element times for a new model toy. (a) Construct the precedence diagram for this job. (b) If the ideal cycle time = 1.1 min. repositioning time = 0.1 min,...
A manual assembly line is to be designed to make a small consumer product. The work...
A manual assembly line is to be designed to make a small consumer product. The work elements, their times, and precedence constraints are given in the table below. The workers will operate the line for 400 min per day and must produce 300 products per day. A mechanized belt, moving at a speed of 1.25 m/min, will transport the products between stations. Because of the variability in the time required to perform the assembly operations, it has been determined that...
1. [Layout Strategy-Line Balancing] The call center department of Jax-steel company needs to service 3,000 calls...
 1. [Layout Strategy-Line Balancing] The call center department of Jax-steel company needs to service 3,000 calls per 40-hour workweek. The process of servicing calls can be broken down into the six stations listed above. The precedence and time requirements for each element are as follows in the table below. The manager wants a new operational analyst to draw and label a precedence diagram for the service process. Finally, the manager needs to balance the line, calculate the efficiency of the...
The operations manager of an instruments company is balancing an assembly line. The company needs to...
 The operations manager of an instruments company is balancing an
assembly line. The company needs to build 96 instruments per
24-hour day. The assembly line activities are:
a. Draw the precedence diagram.
b. If the daily (24-hour) production rate is 96 units, what is
the greatest possible cycle time?
c. If the cycle time after allowances is given as 10 minutes,
what is the daily (24-hour) production rate?
d. With a 10-minute cycle time, what is the theoretical minimum
number...
The operations manager of an instruments company is balancing an
assembly line. The company needs to build 96 instruments per
24-hour day. The assembly line activities are:
a. Draw the precedence diagram.
b. If the daily (24-hour) production rate is 96 units, what is
the greatest possible cycle time?
c. If the cycle time after allowances is given as 10 minutes,
what is the daily (24-hour) production rate?
d. With a 10-minute cycle time, what is the theoretical minimum
number...
DO NOT COPY THE ANSWER FROM ANOTHER SIMILAR QUESTION!!! IT IS INCORRECT!!!! A new electrical device...
 DO NOT COPY THE ANSWER FROM ANOTHER SIMILAR
QUESTION!!! IT IS INCORRECT!!!!
A new electrical device is to be assembled in the new
facility.The line will be operated 250 day/yr, 15 hr/day. The work
content has been divided into work elements as defined in the table
below. Also given are the element times and precedence
requirements. Annual production is to be 400,000 units. It is
anticipated that the line efficiency (proportion uptime) E = 0.97.
The repositioning time for each...
DO NOT COPY THE ANSWER FROM ANOTHER SIMILAR
QUESTION!!! IT IS INCORRECT!!!!
A new electrical device is to be assembled in the new
facility.The line will be operated 250 day/yr, 15 hr/day. The work
content has been divided into work elements as defined in the table
below. Also given are the element times and precedence
requirements. Annual production is to be 400,000 units. It is
anticipated that the line efficiency (proportion uptime) E = 0.97.
The repositioning time for each...
MatchPoint Racket Company manufactures two types of tennis rackets, the Junior and Pro Striker models. The...
MatchPoint Racket Company manufactures two types of tennis rackets, the Junior and Pro Striker models. The production budget for March for the two rackets is as follows: Junior Pro Striker Production budget 8,600 units 24,400 units Both rackets are produced in two departments, Forming and Assembly. The direct labor hours required for each racket are estimated as follows: Forming Department Assembly Department Junior 0.2 hour per unit 0.4 hour per unit Pro Striker 0.3 hour per unit 0.6 hour per...
Solve for a), b) and c) The residual hydrodesulfurization (HDS) process is operated at the capacity...
 Solve for a), b) and c)
The residual hydrodesulfurization (HDS) process is operated at the capacity of 5,000 barrels per day to produce low sulfur fuel for a power plant. The operating conditions are: Type: Fixed bed plug flow reactor Reactor temperature -400°C Reactor pressure - 2100 psi LHSV (Liquid Hourly Space Velocity) - 0.5/hr-flowrate, bbl/hr)/(reactor volume, bbl) Hydrogen gas rate - 23.7 standard liters/hr The sulfur contents of the fuel oil product must be reduced to 1.0 wt%. The...
Solve for a), b) and c)
The residual hydrodesulfurization (HDS) process is operated at the capacity of 5,000 barrels per day to produce low sulfur fuel for a power plant. The operating conditions are: Type: Fixed bed plug flow reactor Reactor temperature -400°C Reactor pressure - 2100 psi LHSV (Liquid Hourly Space Velocity) - 0.5/hr-flowrate, bbl/hr)/(reactor volume, bbl) Hydrogen gas rate - 23.7 standard liters/hr The sulfur contents of the fuel oil product must be reduced to 1.0 wt%. The...
Ellix Company manufactures two models of ultra-high fidelity speakers—the X200 model and the X99 model. Data...
Ellix Company manufactures two models of ultra-high fidelity speakers—the X200 model and the X99 model. Data regarding the two products follow: Product Direct Labor-Hours Annual Production Total Direct Labor-Hours X200 0.3 DLHs per unit 23,000 units 6,900 DLHs X99 0.5 DLHs per unit 46,000 units 23,000 DLHs 29,900 DLHs Additional information about the company follows: a. Model X200 requires $45 in direct materials per unit, and model X99 requires $23. b. The direct labor workers are paid $60 per hour....
Ellix Company manufactures two models of ultra-high fidelity speakers—the X200 model and the X99 model. Data...
Ellix Company manufactures two models of ultra-high fidelity speakers—the X200 model and the X99 model. Data regarding the two products follow: Product Direct Labor-Hours Annual Production Total Direct Labor Hours X200 0.3 DLHs per unit 23,000 units 6,900 DLHs X99 0.5 DLHs per unit 37,000 units 18,500 DLHs 25,400 DLHs Additional information about the company follows: a. Model X200 requires $31 in direct materials per unit, and model X99 requires $29. b. The direct labor workers are paid $30 per...
 4.22 The table below lists the work elements in minutes to be performed on assembly line with precedence requirements. Annual demand is 60000 units. The line will operate on shift (2000 hr/yr). Line efficiency is expected 95% and repositioning time is 6 sec. The table below defines the precedence relationships and element times for a new model toy. (a) Construct the precedence diagram for this job. (b) If the ideal cycle time = 1.1 min. repositioning time = 0.1 min,...
 1. [Layout Strategy-Line Balancing] The call center department of Jax-steel company needs to service 3,000 calls per 40-hour workweek. The process of servicing calls can be broken down into the six stations listed above. The precedence and time requirements for each element are as follows in the table below. The manager wants a new operational analyst to draw and label a precedence diagram for the service process. Finally, the manager needs to balance the line, calculate the efficiency of the...
 The operations manager of an instruments company is balancing an
assembly line. The company needs to build 96 instruments per
24-hour day. The assembly line activities are:
a. Draw the precedence diagram.
b. If the daily (24-hour) production rate is 96 units, what is
the greatest possible cycle time?
c. If the cycle time after allowances is given as 10 minutes,
what is the daily (24-hour) production rate?
d. With a 10-minute cycle time, what is the theoretical minimum
number...
The operations manager of an instruments company is balancing an
assembly line. The company needs to build 96 instruments per
24-hour day. The assembly line activities are:
a. Draw the precedence diagram.
b. If the daily (24-hour) production rate is 96 units, what is
the greatest possible cycle time?
c. If the cycle time after allowances is given as 10 minutes,
what is the daily (24-hour) production rate?
d. With a 10-minute cycle time, what is the theoretical minimum
number...
 DO NOT COPY THE ANSWER FROM ANOTHER SIMILAR
QUESTION!!! IT IS INCORRECT!!!!
A new electrical device is to be assembled in the new
facility.The line will be operated 250 day/yr, 15 hr/day. The work
content has been divided into work elements as defined in the table
below. Also given are the element times and precedence
requirements. Annual production is to be 400,000 units. It is
anticipated that the line efficiency (proportion uptime) E = 0.97.
The repositioning time for each...
DO NOT COPY THE ANSWER FROM ANOTHER SIMILAR
QUESTION!!! IT IS INCORRECT!!!!
A new electrical device is to be assembled in the new
facility.The line will be operated 250 day/yr, 15 hr/day. The work
content has been divided into work elements as defined in the table
below. Also given are the element times and precedence
requirements. Annual production is to be 400,000 units. It is
anticipated that the line efficiency (proportion uptime) E = 0.97.
The repositioning time for each...
 Solve for a), b) and c)
The residual hydrodesulfurization (HDS) process is operated at the capacity of 5,000 barrels per day to produce low sulfur fuel for a power plant. The operating conditions are: Type: Fixed bed plug flow reactor Reactor temperature -400°C Reactor pressure - 2100 psi LHSV (Liquid Hourly Space Velocity) - 0.5/hr-flowrate, bbl/hr)/(reactor volume, bbl) Hydrogen gas rate - 23.7 standard liters/hr The sulfur contents of the fuel oil product must be reduced to 1.0 wt%. The...
Solve for a), b) and c)
The residual hydrodesulfurization (HDS) process is operated at the capacity of 5,000 barrels per day to produce low sulfur fuel for a power plant. The operating conditions are: Type: Fixed bed plug flow reactor Reactor temperature -400°C Reactor pressure - 2100 psi LHSV (Liquid Hourly Space Velocity) - 0.5/hr-flowrate, bbl/hr)/(reactor volume, bbl) Hydrogen gas rate - 23.7 standard liters/hr The sulfur contents of the fuel oil product must be reduced to 1.0 wt%. The...
Most questions answered within 3 hours.
-
Where is the error in this code sequence?
String s1 = "Hello";
String s2 = "ello";...
asked 10 months ago -
Financial data for Joel de Paris, Inc., for last year
follow:
Joel de Paris, Inc.
Balance...
asked 10 months ago -
Consider this reaction:
Al2(SO4)3 (aq)+ BaCl3
(aq) Al2Cl6 (aq)- +
3BaSO4(s) . What is the...
asked 10 months ago -
Suppose that Savneet is considering increasing her
recent random sample from 20 car rentals to 40...
asked 10 months ago -
Trucks arrive at an unloading terminal at an average rate of 120
per hour.
Trucks arrive...
asked 10 months ago -
Why are methanol and ethanol completely soluble in water while
octanol is not very little soluble....
asked 10 months ago -
A facilities manager at a university reads in a research report
that the mean amount of...
asked 10 months ago -
When the CuSO4 is rehydrated by adding water to the anhydrous
compound, is this an endothermic...
asked 10 months ago -
A ray of sunlight is passing from diamond into crown glass; the
angle of incidence is...
asked 10 months ago -
A block of mass 0.249 kg is placed on top of a light, vertical
spring of...
asked 10 months ago -
how do the kidneys compensate in the presences of acidosis
a) trigger hyperventilate
b) reserve acid...
asked 10 months ago -
Question 501 pts
The rental rate of capital to the firm increases. Which of the
following...
asked 10 months ago