
Homework Answers


Add Answer to:
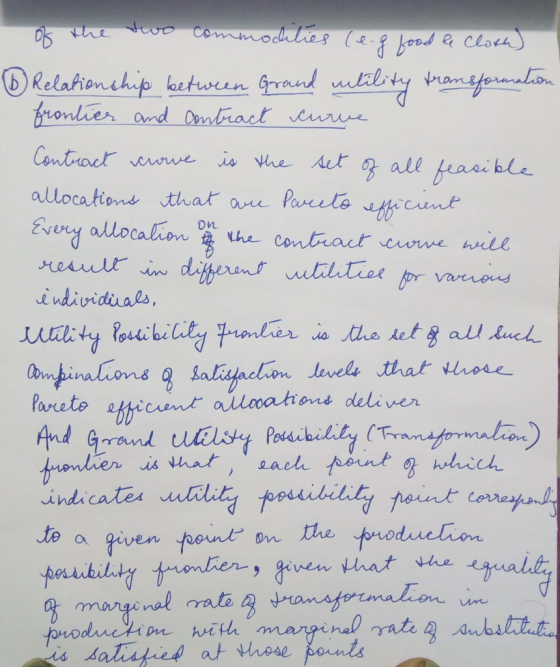
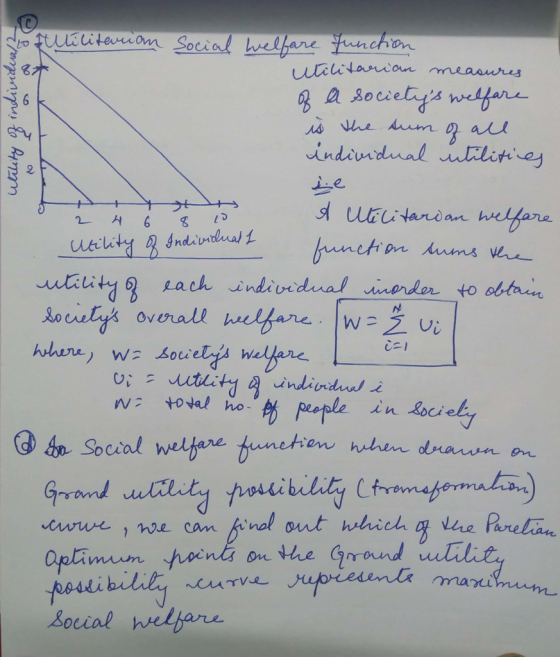
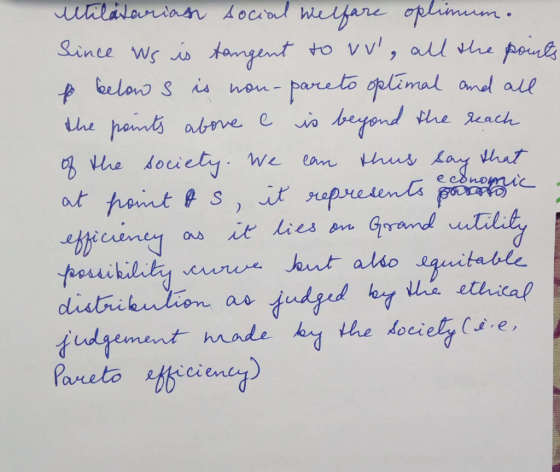
4. This question refers to the relationship between the grand utility transformation frontier and the utilitarian...
C1 [19 marks] Suppose Malcolm and Barnaby are the only two people in a pure exchange...
C1 [19 marks] Suppose Malcolm and Barnaby are the only two people in a pure exchange economy. Food and clothing are the only two commodities. Malcolm is endowed with 30 units of food and 10 units of clothing, while Barnaby is endowed with 10 units of food and 30 units of clothing. Let F = units of food and C = units of clothing. Malcolm’s utility function is UM = 2 min(F, C) and Barnaby’s utility function is UB =...
(20 Marks) QUESTION With the aid of a fully labelled diagram, draw a Production Possibility Frontier (PPF) for an econo...
 (20 Marks) QUESTION With the aid of a fully labelled diagram, draw a Production Possibility Frontier (PPF) for an economy producing computers and pizzas. Use the diagram to explain the concepts of choice, scarcity and opportunity costs. (10 marks) 4.1 2 With reference to the diagram in question 4.1, distinguish between 'efficiency' and 'inefficiency. (4 marks) With the aid of a separate diagram, illustrate and explain what would happen if there was a discovery of an improved technique for producing...
Suppose that the profit of a car producing firm is given by: ? = ?? −...
Suppose that the profit of a car producing firm is given by: ? = ?? − ?(?) And that the cost function is given by: ?(?) = 4? where ? is profits, ? is the price and ? is quantity produced. By setting profits equal to a constant level, ?, derive an expression for the isoprofit curve of this firm which expresses ? as a function of ? (for a given level of profits, ?). c) Let the demand curve...
Harry's relationship between Utility(U) and income (Y) is represented in the table below U(Y) 36 40...
 Harry's relationship between Utility(U) and income (Y) is represented in the table below U(Y) 36 40 46 54 64 76 90 106 Y 4 10 12 14 16 (a) Draw Harry's utility function with Y on horizontal axis and UCY) on the vertical axis using the graph paper. e will (b) Suppose Harry is offered a gamble where with probability 0.5 he will receive 6 and with 0.5 h receive 14. What is the expected value (EY) of this bet?...
Question: Consider a consumer with utility function4, income Z, and who faces market prices of p,...
 Question: Consider a consumer with utility function4, income Z, and who faces market prices of p, and py (a) Use our optimality condition of MRSy MRTay to find the relationship between x and y which must always be satisfied by a bundle that maximizes the consumer's utility (b) After incorporating the consumer's budget to the problem, calculate the consumer's de- mand for x and y which we will call x(P Z) and y(Py, Z), respectively, because it empha- sizes the...
this is the entire question this is all the information given 2. Consider a pure exchange...
 this is the entire question
this is all the information given
2. Consider a pure exchange economy with two goods, wine (x) and cheese (y) and two con- sumers, A and B. Let cheese be the numeraire good with price of $1. Consumer A's utility function is UA(x, y) = 2.c + y and B's utility function is UB(x, y) = xy. A's initial allocation is 10 units of c and 0 units of y. B's initial allocation is 0...
this is the entire question
this is all the information given
2. Consider a pure exchange economy with two goods, wine (x) and cheese (y) and two con- sumers, A and B. Let cheese be the numeraire good with price of $1. Consumer A's utility function is UA(x, y) = 2.c + y and B's utility function is UB(x, y) = xy. A's initial allocation is 10 units of c and 0 units of y. B's initial allocation is 0...
Question 1: Louis the retired Canadian lives on a fixed budget and consumes only two goods:...
 Question 1: Louis the retired Canadian lives on a fixed budget and consumes only two goods: toques (T) and maple syrup (M). Suppose Louis monthly budget is 100 and the price of the two goods are (PT,PM) (4,2). (a) Make a properly labeled diagram illustrating Louis'budget constraint with T on the hori- zontal axis and M on the vertical axis. Indicate the area corresponding to the set of bundles (M, T) that Louis can afford. (b) What is the maximum...
Answer is attached with question. Please help with graph (Question 5:9 points total, 4 for each...
 Answer is attached with question. Please help with graph
(Question 5:9 points total, 4 for each part) Remember Fred and Penny: We assumed a two- person world. Penny is a smoker, Fred is not, and the smoke makes Fred sick. Cigars are provided for free by God, the marginal cost of cigars is zero for both Penny and Fred. Continue to assume that Penny enjoys smoking some cigars and continue to assume that her marginal benefit from each additional cigar...
Answer is attached with question. Please help with graph
(Question 5:9 points total, 4 for each part) Remember Fred and Penny: We assumed a two- person world. Penny is a smoker, Fred is not, and the smoke makes Fred sick. Cigars are provided for free by God, the marginal cost of cigars is zero for both Penny and Fred. Continue to assume that Penny enjoys smoking some cigars and continue to assume that her marginal benefit from each additional cigar...
Start with the demand side. The household in question has the following Cobb- Douglas utility function:...
 Start with the demand side. The household in question has the following Cobb- Douglas utility function: The household also faces the following budget constraint: The above says that the household's after-tax income, (1-T)Y, is divided between consumption of goods and services, C,, and the amount spent on housing services (r+0+ τ.)P,HH, . This latter variable can be thought of as the user cost of housing and consist of the rate of interest (r), the rate of depreciation (6) and residential...
Please answer this question with RStudio. 4. In this problem, you will illustrate the idea of...
 Please answer this question with RStudio.
4. In this problem, you will illustrate the idea of resampling and sampling distributions. A ganma distribution with shape k and scale θ has density exp(-v/0) Assume shape k = 2 and scale θ = 3 (a) Use the function dgamma in R to evaluate the density for a range of values between 0 and 20. Produce a plot of the density (b) The (true) mean and variance of the gamma distribution are simple...
Please answer this question with RStudio.
4. In this problem, you will illustrate the idea of resampling and sampling distributions. A ganma distribution with shape k and scale θ has density exp(-v/0) Assume shape k = 2 and scale θ = 3 (a) Use the function dgamma in R to evaluate the density for a range of values between 0 and 20. Produce a plot of the density (b) The (true) mean and variance of the gamma distribution are simple...
 (20 Marks) QUESTION With the aid of a fully labelled diagram, draw a Production Possibility Frontier (PPF) for an economy producing computers and pizzas. Use the diagram to explain the concepts of choice, scarcity and opportunity costs. (10 marks) 4.1 2 With reference to the diagram in question 4.1, distinguish between 'efficiency' and 'inefficiency. (4 marks) With the aid of a separate diagram, illustrate and explain what would happen if there was a discovery of an improved technique for producing...
 Harry's relationship between Utility(U) and income (Y) is represented in the table below U(Y) 36 40 46 54 64 76 90 106 Y 4 10 12 14 16 (a) Draw Harry's utility function with Y on horizontal axis and UCY) on the vertical axis using the graph paper. e will (b) Suppose Harry is offered a gamble where with probability 0.5 he will receive 6 and with 0.5 h receive 14. What is the expected value (EY) of this bet?...
 Question: Consider a consumer with utility function4, income Z, and who faces market prices of p, and py (a) Use our optimality condition of MRSy MRTay to find the relationship between x and y which must always be satisfied by a bundle that maximizes the consumer's utility (b) After incorporating the consumer's budget to the problem, calculate the consumer's de- mand for x and y which we will call x(P Z) and y(Py, Z), respectively, because it empha- sizes the...
 this is the entire question
this is all the information given
2. Consider a pure exchange economy with two goods, wine (x) and cheese (y) and two con- sumers, A and B. Let cheese be the numeraire good with price of $1. Consumer A's utility function is UA(x, y) = 2.c + y and B's utility function is UB(x, y) = xy. A's initial allocation is 10 units of c and 0 units of y. B's initial allocation is 0...
this is the entire question
this is all the information given
2. Consider a pure exchange economy with two goods, wine (x) and cheese (y) and two con- sumers, A and B. Let cheese be the numeraire good with price of $1. Consumer A's utility function is UA(x, y) = 2.c + y and B's utility function is UB(x, y) = xy. A's initial allocation is 10 units of c and 0 units of y. B's initial allocation is 0...
 Question 1: Louis the retired Canadian lives on a fixed budget and consumes only two goods: toques (T) and maple syrup (M). Suppose Louis monthly budget is 100 and the price of the two goods are (PT,PM) (4,2). (a) Make a properly labeled diagram illustrating Louis'budget constraint with T on the hori- zontal axis and M on the vertical axis. Indicate the area corresponding to the set of bundles (M, T) that Louis can afford. (b) What is the maximum...
 Answer is attached with question. Please help with graph
(Question 5:9 points total, 4 for each part) Remember Fred and Penny: We assumed a two- person world. Penny is a smoker, Fred is not, and the smoke makes Fred sick. Cigars are provided for free by God, the marginal cost of cigars is zero for both Penny and Fred. Continue to assume that Penny enjoys smoking some cigars and continue to assume that her marginal benefit from each additional cigar...
Answer is attached with question. Please help with graph
(Question 5:9 points total, 4 for each part) Remember Fred and Penny: We assumed a two- person world. Penny is a smoker, Fred is not, and the smoke makes Fred sick. Cigars are provided for free by God, the marginal cost of cigars is zero for both Penny and Fred. Continue to assume that Penny enjoys smoking some cigars and continue to assume that her marginal benefit from each additional cigar...
 Start with the demand side. The household in question has the following Cobb- Douglas utility function: The household also faces the following budget constraint: The above says that the household's after-tax income, (1-T)Y, is divided between consumption of goods and services, C,, and the amount spent on housing services (r+0+ τ.)P,HH, . This latter variable can be thought of as the user cost of housing and consist of the rate of interest (r), the rate of depreciation (6) and residential...
 Please answer this question with RStudio.
4. In this problem, you will illustrate the idea of resampling and sampling distributions. A ganma distribution with shape k and scale θ has density exp(-v/0) Assume shape k = 2 and scale θ = 3 (a) Use the function dgamma in R to evaluate the density for a range of values between 0 and 20. Produce a plot of the density (b) The (true) mean and variance of the gamma distribution are simple...
Please answer this question with RStudio.
4. In this problem, you will illustrate the idea of resampling and sampling distributions. A ganma distribution with shape k and scale θ has density exp(-v/0) Assume shape k = 2 and scale θ = 3 (a) Use the function dgamma in R to evaluate the density for a range of values between 0 and 20. Produce a plot of the density (b) The (true) mean and variance of the gamma distribution are simple...
Most questions answered within 3 hours.
-
Where is the error in this code sequence?
String s1 = "Hello";
String s2 = "ello";...
asked 10 months ago -
Financial data for Joel de Paris, Inc., for last year
follow:
Joel de Paris, Inc.
Balance...
asked 10 months ago -
Consider this reaction:
Al2(SO4)3 (aq)+ BaCl3
(aq) Al2Cl6 (aq)- +
3BaSO4(s) . What is the...
asked 10 months ago -
Suppose that Savneet is considering increasing her
recent random sample from 20 car rentals to 40...
asked 10 months ago -
Trucks arrive at an unloading terminal at an average rate of 120
per hour.
Trucks arrive...
asked 10 months ago -
Why are methanol and ethanol completely soluble in water while
octanol is not very little soluble....
asked 10 months ago -
A facilities manager at a university reads in a research report
that the mean amount of...
asked 10 months ago -
When the CuSO4 is rehydrated by adding water to the anhydrous
compound, is this an endothermic...
asked 10 months ago -
A ray of sunlight is passing from diamond into crown glass; the
angle of incidence is...
asked 10 months ago -
A block of mass 0.249 kg is placed on top of a light, vertical
spring of...
asked 10 months ago -
how do the kidneys compensate in the presences of acidosis
a) trigger hyperventilate
b) reserve acid...
asked 10 months ago -
Question 501 pts
The rental rate of capital to the firm increases. Which of the
following...
asked 10 months ago