Help with writing morse code
![]() Screen Shot 2021-03-17 at 9.57.42 AM.png
Screen Shot 2021-03-17 at 9.57.42 AM.png
![]() Screen Shot 2021-03-17 at 9.57.49 AM.png
Screen Shot 2021-03-17 at 9.57.49 AM.png
3 Decoding a Morse Code message
In this exercise you will decipher a Morse code message sent to Agent 008 by Agent \(007 .\) The last words of Agent 007 were "The future of technology lies in \(\ldots\) " at which point she produced a memory stick containing a MATLAB file ctftmod.mat. The file ctftmod \(.\) mat contains the following:
af, bf the denominator and numerator coefficients of a lowpass filter, whose frequency response can be plotted using the freqs command, i.e., freqs (bf, af).
- Modulation frequencies \(\mathrm{f} 1\) and \(\mathrm{f} 2\).
- Two prototype signals dot and dash.
- Signal \(x(t)\)
A time vector t.
The signal \(x(t)\) is of the form \(x(t)=m_{1}(t) \cos \left(2 \pi f_{1} t\right)+m_{2}(t) \sin \left(2 \pi f_{2} t\right)+m_{3}(t) \sin \left(2 \pi f_{1} t\right) .\) It is known that
\(m_{1}(t), m_{2}(t)\) and \(m_{3}(t)\) correspond to single letters of alphabet which has been encoded using International Morse code. Morse code encodes characters as standardized sequence of dots and dashes (signals dot and dash are given in the file). To read more about Morse Code and to find sequence of dots and dashes corresponding to each alphabet visit this link.
1. Using the signals dot and dash, construct the signal that corresponds to ' \(Z\) ' in Morse code and plot it against t. As an example, the letter \(\mathrm{C}\) can be constructed by, \(\mathrm{c}=\) [ dash dot dash dot ].
2. Plot the frequency response of the filter using freqs (bf, af).
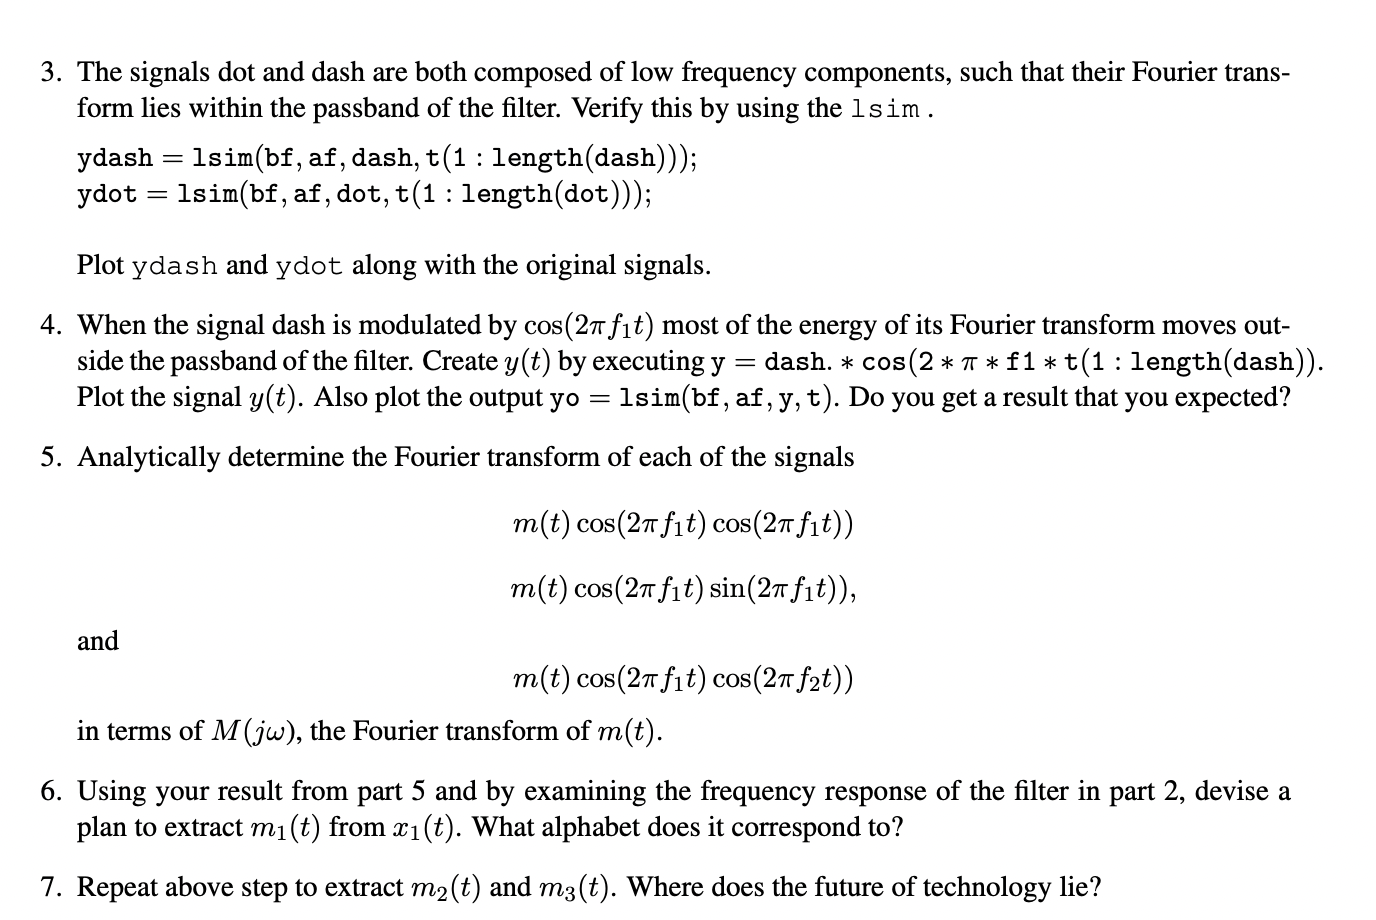
3. The signals dot and dash are both composed of low frequency components, such that their Fourier transform lies within the passband of the filter. Verify this by using the \(1 \mathrm{sim}\).
ydash \(=1 \operatorname{sim}(b f, a f,\) dash, \(t(1:\) length \((\) dash \()))\)
\(y\) dot \(=1 \operatorname{sim}(b f, a f, \operatorname{dot}, t(1:\) length \((\) dot \()))\)
Plot ydash and ydot along with the original signals.
4. When the signal dash is modulated by \(\cos \left(2 \pi f_{1} t\right)\) most of the energy of its Fourier transform moves outside the passband of the filter. Create \(y(t)\) by executing \(\mathrm{y}=\) dash. \(* \cos (2 * \pi * \mathrm{f} 1 * \mathrm{t}(1:\) length \((\) dash \())\). Plot the signal \(y(t)\). Also plot the output yo \(=1\) sim(bf, af, \(y, t)\). Do you get a result that you expected?
5. Analytically determine the Fourier transform of each of the signals
$$ \begin{array}{l} \left.m(t) \cos \left(2 \pi f_{1} t\right) \cos \left(2 \pi f_{1} t\right)\right) \\ \left.m(t) \cos \left(2 \pi f_{1} t\right) \sin \left(2 \pi f_{1} t\right)\right) \end{array} $$
and
$$ \left.m(t) \cos \left(2 \pi f_{1} t\right) \cos \left(2 \pi f_{2} t\right)\right) $$
in terms of \(M(j \omega),\) the Fourier transform of \(m(t)\).
6. Using your result from part 5 and by examining the frequency response of the filter in part \(2,\) devise a plan to extract \(m_{1}(t)\) from \(x_{1}(t) .\) What alphabet does it correspond to?
7. Repeat above step to extract \(m_{2}(t)\) and \(m_{3}(t) .\) Where does the future of technology lie?
Thank you
Homework Answers
Request Answer!
We need at least 9 more requests to produce the answer.
1 / 10 have requested this problem solution
The more requests, the faster the answer.
This is taken from Section 4.6, "Amplitude Modulation and the Continuous-Time Fourier Transform," in the course...
 This is taken from Section 4.6, "Amplitude Modulation and the
Continuous-Time Fourier Transform," in the course text Computer
Explorations in signals and systems by Buck, Daniel, Singer, 2nd
Edition. I need the answers for the basic and intermediate
questions.
4.6 Amplitude Modulation and the Continuous-Time Fouriei Transform This exercise will explore amplitude modulation of Morse code messages. A simple ampli tude modulation system can be described by x(t) = m(t) cos(Crfot), (4.13) where m(t) is called the message waveform and...
This is taken from Section 4.6, "Amplitude Modulation and the
Continuous-Time Fourier Transform," in the course text Computer
Explorations in signals and systems by Buck, Daniel, Singer, 2nd
Edition. I need the answers for the basic and intermediate
questions.
4.6 Amplitude Modulation and the Continuous-Time Fouriei Transform This exercise will explore amplitude modulation of Morse code messages. A simple ampli tude modulation system can be described by x(t) = m(t) cos(Crfot), (4.13) where m(t) is called the message waveform and...
Write a Matlab code to generate the signal y(t)=10*(cos(2*pi*f1*t)+ cos(2*pi*f2*t)+ cos(2*pi*f3*t)), where f1=500 Hz, f2=750 Hz...
Write a Matlab code to generate the signal y(t)=10*(cos(2*pi*f1*t)+ cos(2*pi*f2*t)+ cos(2*pi*f3*t)), where f1=500 Hz, f2=750 Hz and f3=1000 Hz. Plot the signal in time domain. Sketch the Fourier transform of the signal with appropriately generating frequency axis. Apply an appropriate filter to y(t) so that signal part with frequency f1 can be extracted. Sketch the Fourier transform of the extracted signal. Apply an appropriate filter to y(t) so that signal part with frequency f2 can be extracted. Sketch the Fourier...
A certain FM signal is given by:
 A certain FM signal is given by: \(s(t)=A_{c} \cos \left[2 \pi f_{c} t+2 \pi k_{f} \int_{0}^{t} m(\tau) d \tau\right]\). Estimate the bandwidth of \(s(t)\) using Carson's rule. Assume the spectrum of m(t) is given by:$$ \begin{array}{rr} M(f)=\operatorname{rect}(f) \text { and } \operatorname{rect}(f)=1 & -10 \mathrm{kHz} \leq f \leq 10 \mathrm{kHz} \\ \operatorname{rect}(f)=0 & |f| \geq 10 \mathrm{kHz} \end{array} $$Assume \(k_{f}=2 \mathrm{kHz} /\) volt. Also estimate the bandwidth using Figure 4.9. Compare your results.(Hint: Consider your response to question 5.) from...
Program Description: A Java program is to be created to produce Morse code. The Morse code...
Program Description: A Java program is to be created to produce Morse code. The Morse code assigns a series of dots and dashes to each letter of the alphabet, each digit, and a few special characters (such as period, comma, colon, and semicolon). In sound-oriented systems, the dot represents a short sound and the dash represents a long sound. Separation between words is indicated by a space, or, quite simply, the absence of a dot or dash. In a sound-oriented...
1. Create the following signals, f1, f2 in time domain. t = 0 to 1 second....
1. Create the following signals, f1, f2 in time domain. t = 0 to 1 second. f1(t) = 8 sin (2 *pi*80*t); f2(t) = 4 cos (2*pi*240*t) Define any assumptions you make to generate the signals. 2. Plot the two graphs as sub plots with appropriate lables in x axis (time), y axis, title etc. 3. Generate the following signal f3 = f1 + f2; 4. Plot as sub plot in (2). 5. Compute the fourier transform of this signal,...
please show MATLAB code with results please MATLAB Provide printouts of the program and results where...
 please show MATLAB code with results please
MATLAB Provide printouts of the program and results where you calculated the Fourier transform of the following: Each student will substitute the last two numbers from their student ID number for the letter "a" ult-a) Wribc an ID nunber 6(t+a) rect(t/a) (a/n)(sinc(at/n) expljat) cos(at) sin(at)u(t) See the attached examples Fourier Page 1 of Fourier Transform syms t w f-cos (2 *pi*t) ; fourier (f,w) ADe 2 Fourier Page 1 of Foutier Transform syms...
please show MATLAB code with results please
MATLAB Provide printouts of the program and results where you calculated the Fourier transform of the following: Each student will substitute the last two numbers from their student ID number for the letter "a" ult-a) Wribc an ID nunber 6(t+a) rect(t/a) (a/n)(sinc(at/n) expljat) cos(at) sin(at)u(t) See the attached examples Fourier Page 1 of Fourier Transform syms t w f-cos (2 *pi*t) ; fourier (f,w) ADe 2 Fourier Page 1 of Foutier Transform syms...
3. You have bought a data acquisition device from Ebay. The sampling interval of the device is 1 msec. a. What is the sampling frequency of the device? What is the folding frequency of the device? No...
 3. You have bought a data acquisition device from Ebay. The sampling interval of the device is 1 msec. a. What is the sampling frequency of the device? What is the folding frequency of the device? Now, you are measuring following sinusoidal signals with the data acquisition device. For each signal, draw 1) Fourier transform magnitude of the original continuous-time signal, 2) Fourier transform magnitude of the sampled signal (draw at least first positive replica and first negative replica), 3)...
I need help with the following problem: Consider a periodic signal !(t), with period T, such...
 I need help with the following problem:
Consider a periodic signal !(t), with period T, such that !(t) 0, 圹 From Example 2.3.1 of the class notes, the nth Fourier coefficient of r(t) is given by in012... a) Use Fourier series, and the symmetry of the sinc function, to express r(t) in terms of cosine functions. Do we also need sine functions in this representation? b) Suppase that is a signal with Fourier transform S Find and plot the Fourier...
I need help with the following problem:
Consider a periodic signal !(t), with period T, such that !(t) 0, 圹 From Example 2.3.1 of the class notes, the nth Fourier coefficient of r(t) is given by in012... a) Use Fourier series, and the symmetry of the sinc function, to express r(t) in terms of cosine functions. Do we also need sine functions in this representation? b) Suppase that is a signal with Fourier transform S Find and plot the Fourier...
There is a system that can multiply and / or add several input signals (constants or variables) i...
 There is a system that can multiply and / or add
several input signals (constants or variables) in the time domain;
the input signals are f1 (t), f2 (t) and f3; the output signals are
f4 (t), f5 (t) and f6 (t). The substime lowpass filter (FPBj) is a
system that has a transfer function h (t) (H (w)), with unit gain
in the operating area and cutoff frequency of + - 400 Hz. (The
filter gain passes abruptly from...
There is a system that can multiply and / or add
several input signals (constants or variables) in the time domain;
the input signals are f1 (t), f2 (t) and f3; the output signals are
f4 (t), f5 (t) and f6 (t). The substime lowpass filter (FPBj) is a
system that has a transfer function h (t) (H (w)), with unit gain
in the operating area and cutoff frequency of + - 400 Hz. (The
filter gain passes abruptly from...
1. Draw frequency domain representations (sketches of the real and imaginary parts of the Fourier transform)...
1. Draw frequency domain representations (sketches of the real and imaginary parts of the Fourier transform) for both cos(2*pi*fc*t) and sin(2*pi*fc*t), for a carrier waveform. ____________________ Now suppose we have a sinusoidal signal of frequency fi, where fi << fc. Let the signal be m(t)=cos(2*pi*fi*t) and the carrier be cos(2*pi*fc*t). Say we mix m(t) up to carrier frequency fc when we multiply m(t) by the carrier to create the modulated signal, s(t) = m(t) * cos(2*pi*fc*t). Draw the real part...
 This is taken from Section 4.6, "Amplitude Modulation and the
Continuous-Time Fourier Transform," in the course text Computer
Explorations in signals and systems by Buck, Daniel, Singer, 2nd
Edition. I need the answers for the basic and intermediate
questions.
4.6 Amplitude Modulation and the Continuous-Time Fouriei Transform This exercise will explore amplitude modulation of Morse code messages. A simple ampli tude modulation system can be described by x(t) = m(t) cos(Crfot), (4.13) where m(t) is called the message waveform and...
This is taken from Section 4.6, "Amplitude Modulation and the
Continuous-Time Fourier Transform," in the course text Computer
Explorations in signals and systems by Buck, Daniel, Singer, 2nd
Edition. I need the answers for the basic and intermediate
questions.
4.6 Amplitude Modulation and the Continuous-Time Fouriei Transform This exercise will explore amplitude modulation of Morse code messages. A simple ampli tude modulation system can be described by x(t) = m(t) cos(Crfot), (4.13) where m(t) is called the message waveform and...
 A certain FM signal is given by: \(s(t)=A_{c} \cos \left[2 \pi f_{c} t+2 \pi k_{f} \int_{0}^{t} m(\tau) d \tau\right]\). Estimate the bandwidth of \(s(t)\) using Carson's rule. Assume the spectrum of m(t) is given by:$$ \begin{array}{rr} M(f)=\operatorname{rect}(f) \text { and } \operatorname{rect}(f)=1 & -10 \mathrm{kHz} \leq f \leq 10 \mathrm{kHz} \\ \operatorname{rect}(f)=0 & |f| \geq 10 \mathrm{kHz} \end{array} $$Assume \(k_{f}=2 \mathrm{kHz} /\) volt. Also estimate the bandwidth using Figure 4.9. Compare your results.(Hint: Consider your response to question 5.) from...
 please show MATLAB code with results please
MATLAB Provide printouts of the program and results where you calculated the Fourier transform of the following: Each student will substitute the last two numbers from their student ID number for the letter "a" ult-a) Wribc an ID nunber 6(t+a) rect(t/a) (a/n)(sinc(at/n) expljat) cos(at) sin(at)u(t) See the attached examples Fourier Page 1 of Fourier Transform syms t w f-cos (2 *pi*t) ; fourier (f,w) ADe 2 Fourier Page 1 of Foutier Transform syms...
please show MATLAB code with results please
MATLAB Provide printouts of the program and results where you calculated the Fourier transform of the following: Each student will substitute the last two numbers from their student ID number for the letter "a" ult-a) Wribc an ID nunber 6(t+a) rect(t/a) (a/n)(sinc(at/n) expljat) cos(at) sin(at)u(t) See the attached examples Fourier Page 1 of Fourier Transform syms t w f-cos (2 *pi*t) ; fourier (f,w) ADe 2 Fourier Page 1 of Foutier Transform syms...
 3. You have bought a data acquisition device from Ebay. The sampling interval of the device is 1 msec. a. What is the sampling frequency of the device? What is the folding frequency of the device? Now, you are measuring following sinusoidal signals with the data acquisition device. For each signal, draw 1) Fourier transform magnitude of the original continuous-time signal, 2) Fourier transform magnitude of the sampled signal (draw at least first positive replica and first negative replica), 3)...
 I need help with the following problem:
Consider a periodic signal !(t), with period T, such that !(t) 0, 圹 From Example 2.3.1 of the class notes, the nth Fourier coefficient of r(t) is given by in012... a) Use Fourier series, and the symmetry of the sinc function, to express r(t) in terms of cosine functions. Do we also need sine functions in this representation? b) Suppase that is a signal with Fourier transform S Find and plot the Fourier...
I need help with the following problem:
Consider a periodic signal !(t), with period T, such that !(t) 0, 圹 From Example 2.3.1 of the class notes, the nth Fourier coefficient of r(t) is given by in012... a) Use Fourier series, and the symmetry of the sinc function, to express r(t) in terms of cosine functions. Do we also need sine functions in this representation? b) Suppase that is a signal with Fourier transform S Find and plot the Fourier...
 There is a system that can multiply and / or add
several input signals (constants or variables) in the time domain;
the input signals are f1 (t), f2 (t) and f3; the output signals are
f4 (t), f5 (t) and f6 (t). The substime lowpass filter (FPBj) is a
system that has a transfer function h (t) (H (w)), with unit gain
in the operating area and cutoff frequency of + - 400 Hz. (The
filter gain passes abruptly from...
There is a system that can multiply and / or add
several input signals (constants or variables) in the time domain;
the input signals are f1 (t), f2 (t) and f3; the output signals are
f4 (t), f5 (t) and f6 (t). The substime lowpass filter (FPBj) is a
system that has a transfer function h (t) (H (w)), with unit gain
in the operating area and cutoff frequency of + - 400 Hz. (The
filter gain passes abruptly from...
Most questions answered within 3 hours.
-
Where is the error in this code sequence?
String s1 = "Hello";
String s2 = "ello";...
asked 11 months ago -
Financial data for Joel de Paris, Inc., for last year
follow:
Joel de Paris, Inc.
Balance...
asked 11 months ago -
Consider this reaction:
Al2(SO4)3 (aq)+ BaCl3
(aq) Al2Cl6 (aq)- +
3BaSO4(s) . What is the...
asked 11 months ago -
Suppose that Savneet is considering increasing her
recent random sample from 20 car rentals to 40...
asked 11 months ago -
Trucks arrive at an unloading terminal at an average rate of 120
per hour.
Trucks arrive...
asked 11 months ago -
Why are methanol and ethanol completely soluble in water while
octanol is not very little soluble....
asked 11 months ago -
A facilities manager at a university reads in a research report
that the mean amount of...
asked 11 months ago -
When the CuSO4 is rehydrated by adding water to the anhydrous
compound, is this an endothermic...
asked 11 months ago -
A ray of sunlight is passing from diamond into crown glass; the
angle of incidence is...
asked 11 months ago -
A block of mass 0.249 kg is placed on top of a light, vertical
spring of...
asked 11 months ago -
how do the kidneys compensate in the presences of acidosis
a) trigger hyperventilate
b) reserve acid...
asked 11 months ago -
Question 501 pts
The rental rate of capital to the firm increases. Which of the
following...
asked 11 months ago