Prepare a Retail_Shop_Customer Table and explain your understanding by giving sample data on different Customer (CustomID)...
Homework Answers
ANSWER:
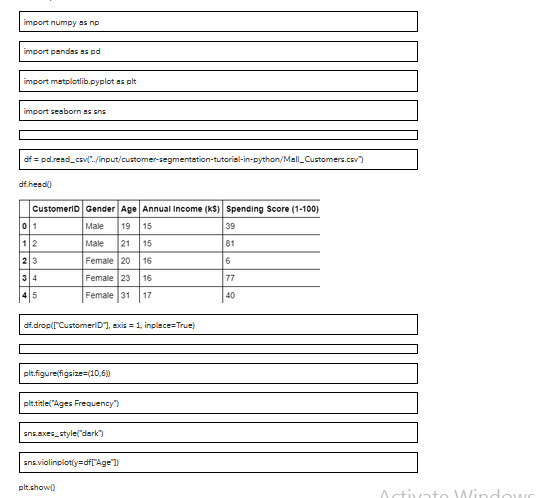
Customer Segmentation is the subdivision of a market into discrete customer groups that share similar characteristics. Customer Segmentation can be a powerful means to identify unsatisfied customer needs. Using the above data companies can then outperform the competition by developing uniquely appealing products and services.The most common ways in which businesses segment their customer base are:
Demographic information, such as gender, age, familial and
marital status, income, education, and occupation.
Geographical information, which differs depending on the scope of
the company. For localized businesses, this info might pertain to
specific towns or counties. For larger companies, it might mean a
customer’s city, state, or even country of residence.
Psychographics, such as social class, lifestyle, and personality
traits.
Behavioral data, such as spending and consumption habits,
product/service usage, and desired benefits.
Advantages of Customer Segmentation
Determine appropriate product pricing.
Develop customized marketing campaigns.
Design an optimal distribution strategy.
Choose specific product features for deployment.
Prioritize new product development efforts.
K Means Clustering Algorithm
Specify number of clusters K.
Initialize centroids by first shuffling the dataset and then
randomly selecting K data points for the centroids without
replacement.
Keep iterating until there is no change to the centroids. i.e
assignment of data points to clusters isn’t changing.


Add Answer to:
Prepare a Retail_Shop_Customer Table and explain your
understanding by giving sample data on different Customer
(CustomID)...
NAME BIOL 130 Read over the statistical appendix at the end of your lab packet, paying...
 NAME BIOL 130 Read over the statistical appendix at the end of your lab packet, paying particular attention to examples one and two. Use this information to help you with the following sample problems. CRICKET BEHAVIOR PRELAB PRACTICE DATA ANALYSIS 1. Experiment A in your cricket lab tests the following hypothesis: The behavior of Cricket 1 will be significanty different from the behavior of Cricket 2 when they are interacting with each other z2 CONTINGENCY TABLE TEST What is your...
Consider the data in the table collected from four independent populations. Sample Sample Sample Sample 1...
 Consider the data in the table collected from four independent populations. Sample Sample Sample Sample 1 2 4 17 16 10 4 11 20 5 a) Calculate the total sum of squares (SST). b) Partition the SST into its two components, the sum of squares between (SSB) and the sum of squares within (SSW) c) Using a 0.05, what conclusions can be made concerning the population means? 14 23 3 9 Click the icon to view a table of critical...
Business Analytics, Assignment on Clustering As part of the quarterly reviews, the manager of a r...
Business Analytics, Assignment on Clustering As part of the quarterly reviews, the manager of a retail store analyzes the quality of customer service based on the periodic customer satisfaction ratings (on a scale of 1 to 10 with 1 = Poor and 10 = Excellent). To understand the level of service quality, which includes the waiting times of the customers in the checkout section, he collected data on 100 customers who visited the store; see the attached Excel file: ServiceQuality....
A multinomial experiment with k- 4 cells and associated cell counts produced the data shown in the following table. Category 1 Category 2 Category 3 Category 4 62 |42 |37 Test the following hypothes...
 A multinomial experiment with k- 4 cells and associated cell counts produced the data shown in the following table. Category 1 Category 2 Category 3 Category 4 62 |42 |37 Test the following hypothesis: Ho: pi-P2 = P3 = p4 , HA: At least one of the proportions exceeds 1/4. Calculate the Chi-Squared,x2 test statistic. Round your answer to 2 decimal places A multinomial experiment with k = 4 cells and associated cell counts produced the data shown in the...
a) Consider the dataset in Table 1. Grade, Bumpiness and Speed-limit are the features and Speed...
a) Consider the dataset in Table 1. Grade, Bumpiness and Speed-limit are the features and Speed is label. Table 1: Dataset for decision tree SN Grade Bumpiness Speed-limit Speed 1 steep bumpiness yes slow 2 steep smooth yes slow 3 flat bumpiness no fast 4 steep smooth no fast Answer the followings: i) Determine the entropy of Speed. ii) Which attribute should be selected as a root of the decision tree? iii) Construct the decision tree for this dataset based...
Prepare a table. These are the values I got. 4] Prepare a table for your volume...
 Prepare a table.
These are the values I got.
4] Prepare a table for your volume and density measurements. You have to present the volumes and densities for the cylinder calculated using the two instruments. Refer to the tutorial How to prepore a table to know how to prepare a table for the physics labs. Your table should contain columns for the measuring instruments, the volumes (in mm3) and the densities (in kg/m3). Don't forget to incdlude uncertainties! Data sheet...
Prepare a table.
These are the values I got.
4] Prepare a table for your volume and density measurements. You have to present the volumes and densities for the cylinder calculated using the two instruments. Refer to the tutorial How to prepore a table to know how to prepare a table for the physics labs. Your table should contain columns for the measuring instruments, the volumes (in mm3) and the densities (in kg/m3). Don't forget to incdlude uncertainties! Data sheet...
Using the data table: Does the data suggest that the two inputs are perfect complements? Explain....
 Using the data table:
Does the data suggest that the two inputs are perfect
complements? Explain.
Does the data suggest that the two inputs are Perfect
Substitutes? Explain.
Does the data suggest that the production function is
Cobb-Douglas? Explain.
What type of returns to scale do you observe? Explain.
Complete Table 2.
Assuming that the price of labor is w = 10 and the price of
capital is k=40, use Table 1 to do the following:
Complete Table 3.
If...
Using the data table:
Does the data suggest that the two inputs are perfect
complements? Explain.
Does the data suggest that the two inputs are Perfect
Substitutes? Explain.
Does the data suggest that the production function is
Cobb-Douglas? Explain.
What type of returns to scale do you observe? Explain.
Complete Table 2.
Assuming that the price of labor is w = 10 and the price of
capital is k=40, use Table 1 to do the following:
Complete Table 3.
If...
The data in the accompanying table indicate the driving distance, in yards, from a random sample...
 The data in the accompanying table indicate the driving distance, in yards, from a random sample of drives for three golfers a. Perform a one-way ANOVA using a 0.05 to determine if there is a difference in the average driving distance these three players b. Perform a multiple comparison test to determine which pairs are different using 0.05. EEE Click the icon to view the data table Click the icon to view a table of critical values for the studentized...
For each part create two different data distributions ( data sets ) having the specified properties...
For each part create two different data distributions ( data sets ) having the specified properties by choosing nine values from the set {1, 2, 3, 4, 5} and construct a histogram of each of your two distributions. a- The two distributions have equal means but different standard deviations. b- The two distributions have different means but equal standard deviations. c- The two distributions have equal means and equal standard deviations (but the means need not equal the standard deviations)
Understanding Production Possibilities Using the following table for a hypothetical economy plot your data on a...
 Understanding Production Possibilities Using the following table for a hypothetical economy plot your data on a graph. Military 110 5 10s o 95 15 80 Consumer 0 60 40 35 50 10 20 60 Suppose the Economy is operating at point B. What is the opportunity cost of 10 additional units of consumer goods? Between which points is the opportunity cost of b producing consumer goods at maximum? A combination of 70 units of military goods and 45 units of...
 NAME BIOL 130 Read over the statistical appendix at the end of your lab packet, paying particular attention to examples one and two. Use this information to help you with the following sample problems. CRICKET BEHAVIOR PRELAB PRACTICE DATA ANALYSIS 1. Experiment A in your cricket lab tests the following hypothesis: The behavior of Cricket 1 will be significanty different from the behavior of Cricket 2 when they are interacting with each other z2 CONTINGENCY TABLE TEST What is your...
 Consider the data in the table collected from four independent populations. Sample Sample Sample Sample 1 2 4 17 16 10 4 11 20 5 a) Calculate the total sum of squares (SST). b) Partition the SST into its two components, the sum of squares between (SSB) and the sum of squares within (SSW) c) Using a 0.05, what conclusions can be made concerning the population means? 14 23 3 9 Click the icon to view a table of critical...
 A multinomial experiment with k- 4 cells and associated cell counts produced the data shown in the following table. Category 1 Category 2 Category 3 Category 4 62 |42 |37 Test the following hypothesis: Ho: pi-P2 = P3 = p4 , HA: At least one of the proportions exceeds 1/4. Calculate the Chi-Squared,x2 test statistic. Round your answer to 2 decimal places A multinomial experiment with k = 4 cells and associated cell counts produced the data shown in the...
 Prepare a table.
These are the values I got.
4] Prepare a table for your volume and density measurements. You have to present the volumes and densities for the cylinder calculated using the two instruments. Refer to the tutorial How to prepore a table to know how to prepare a table for the physics labs. Your table should contain columns for the measuring instruments, the volumes (in mm3) and the densities (in kg/m3). Don't forget to incdlude uncertainties! Data sheet...
Prepare a table.
These are the values I got.
4] Prepare a table for your volume and density measurements. You have to present the volumes and densities for the cylinder calculated using the two instruments. Refer to the tutorial How to prepore a table to know how to prepare a table for the physics labs. Your table should contain columns for the measuring instruments, the volumes (in mm3) and the densities (in kg/m3). Don't forget to incdlude uncertainties! Data sheet...
 Using the data table:
Does the data suggest that the two inputs are perfect
complements? Explain.
Does the data suggest that the two inputs are Perfect
Substitutes? Explain.
Does the data suggest that the production function is
Cobb-Douglas? Explain.
What type of returns to scale do you observe? Explain.
Complete Table 2.
Assuming that the price of labor is w = 10 and the price of
capital is k=40, use Table 1 to do the following:
Complete Table 3.
If...
Using the data table:
Does the data suggest that the two inputs are perfect
complements? Explain.
Does the data suggest that the two inputs are Perfect
Substitutes? Explain.
Does the data suggest that the production function is
Cobb-Douglas? Explain.
What type of returns to scale do you observe? Explain.
Complete Table 2.
Assuming that the price of labor is w = 10 and the price of
capital is k=40, use Table 1 to do the following:
Complete Table 3.
If...
 The data in the accompanying table indicate the driving distance, in yards, from a random sample of drives for three golfers a. Perform a one-way ANOVA using a 0.05 to determine if there is a difference in the average driving distance these three players b. Perform a multiple comparison test to determine which pairs are different using 0.05. EEE Click the icon to view the data table Click the icon to view a table of critical values for the studentized...
 Understanding Production Possibilities Using the following table for a hypothetical economy plot your data on a graph. Military 110 5 10s o 95 15 80 Consumer 0 60 40 35 50 10 20 60 Suppose the Economy is operating at point B. What is the opportunity cost of 10 additional units of consumer goods? Between which points is the opportunity cost of b producing consumer goods at maximum? A combination of 70 units of military goods and 45 units of...
Most questions answered within 3 hours.
-
Where is the error in this code sequence?
String s1 = "Hello";
String s2 = "ello";...
asked 10 months ago -
Financial data for Joel de Paris, Inc., for last year
follow:
Joel de Paris, Inc.
Balance...
asked 10 months ago -
Consider this reaction:
Al2(SO4)3 (aq)+ BaCl3
(aq) Al2Cl6 (aq)- +
3BaSO4(s) . What is the...
asked 10 months ago -
Suppose that Savneet is considering increasing her
recent random sample from 20 car rentals to 40...
asked 10 months ago -
Trucks arrive at an unloading terminal at an average rate of 120
per hour.
Trucks arrive...
asked 10 months ago -
Why are methanol and ethanol completely soluble in water while
octanol is not very little soluble....
asked 10 months ago -
A facilities manager at a university reads in a research report
that the mean amount of...
asked 10 months ago -
When the CuSO4 is rehydrated by adding water to the anhydrous
compound, is this an endothermic...
asked 10 months ago -
A ray of sunlight is passing from diamond into crown glass; the
angle of incidence is...
asked 10 months ago -
A block of mass 0.249 kg is placed on top of a light, vertical
spring of...
asked 10 months ago -
how do the kidneys compensate in the presences of acidosis
a) trigger hyperventilate
b) reserve acid...
asked 10 months ago -
Question 501 pts
The rental rate of capital to the firm increases. Which of the
following...
asked 10 months ago