For each part create two different data distributions ( data sets ) having the specified properties...
For each part create two different data distributions ( data sets ) having the specified properties by choosing nine values from the set {1, 2, 3, 4, 5} and construct a histogram of each of your two distributions.
a- The two distributions have equal means but different standard deviations.
b- The two distributions have different means but equal standard deviations.
c- The two distributions have equal means and equal standard deviations (but the means need not equal the standard deviations)
Homework Answers
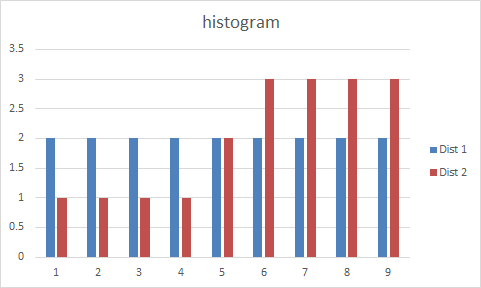
a) example of such distributions
| Dist 1 | Dist 2 | |
| 2 | 1 | |
| 2 | 1 | |
| 2 | 1 | |
| 2 | 1 | |
| 2 | 2 | |
| 2 | 3 | |
| 2 | 3 | |
| 2 | 3 | |
| 2 | 3 | |
| Mean | 2 | 2 |
| SD | 0 | 0.942809 |
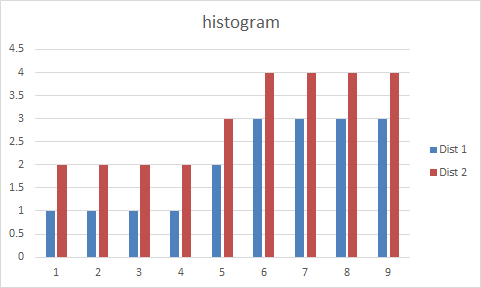
b) different means but equal standard deviations:
| Dist 1 | Dist 2 | |
| 1 | 2 | |
| 1 | 2 | |
| 1 | 2 | |
| 1 | 2 | |
| 2 | 3 | |
| 3 | 4 | |
| 3 | 4 | |
| 3 | 4 | |
| 3 | 4 | |
| Mean | 2 | 3 |
| SD | 0.942809 | 0.942809 |
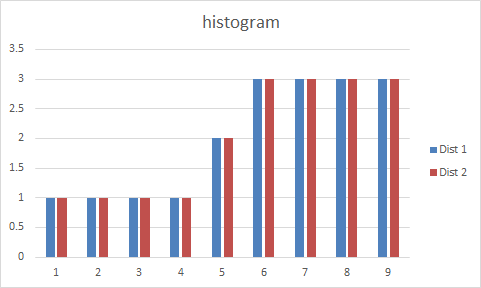
c) equal means and equal standard deviations and mean not equal to SD
| Dist 1 | Dist 2 | |
| 1 | 1 | |
| 1 | 1 | |
| 1 | 1 | |
| 1 | 1 | |
| 2 | 2 | |
| 3 | 3 | |
| 3 | 3 | |
| 3 | 3 | |
| 3 | 3 | |
| Mean | 2 | 2 |
| SD | 0.942809 | 0.942809 |
Add Answer to:
For each part create two different data distributions ( data
sets ) having the specified properties...
How are the two distributions different? How are the two distributions different? -3 -2 -1 2...
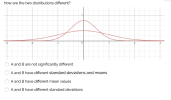 How are the two distributions different?
 -3 -2 -1 2 A and B are not significantly different A and B have different standard deviations and means A and B have different mean values A and B ha ve different standard deviations
How are the two distributions different?
How are the two distributions different? -3 -2 -1 2 A and B are not significantly different A and B have different standard deviations and means A and B have different mean values A and B ha ve different standard deviations
Means and SDs For each part, compare distributions (1) and (2) based on their means and...
 Means and SDs For each part, compare distributions (1) and (2) based on their means and standard deviations. You do not need to calculate these statistics; simply state how the means and the standard deviations compare. You will need to look at Exercise 1.47 in OpenIntro Statistics to answer these questions There are two correct answers to each part below; select them both. 1.47 Means and SDs. For each part, compare distributions (1) and (2) based on their means and...
Consider two data sets A and B. The sets are identical except the high value of...
Consider two data sets A and B. The sets are identical except the high value of the data set B is three times greater than the high value of data set A. (a) How do the median of the two data sets compare? (b) How do the means of the two data sets compare? (c) How do the standard deviations of the two data sets compare? (d) How do the box- and –whisker plots of the two data sets compare?...
Use Random number generator (under Data Analysis) to create two sets of data each 20 points...
Use Random number generator (under Data Analysis) to create two sets of data each 20 points long. Use the following parameters: number of variables (2), number of data point (20), Distribution (Normal), Mean (20), Standard Deviation (5), Random seed (4565). Perform t-test on these two data sets. And answer the questions for Assessment. (Pick the closest answer) 1. What is the range P-value? a. Between 0% and 1% b. Between 1% and 2% c. Between 2% and 3% d. None...
2. Comparing smaller data sets using box plots Two data sets describing the fraction of protein...
 2. Comparing smaller data sets using box plots Two data sets describing the fraction of protein recovered from thirteen test samples by each of two different methods are given in the table below Method1 Method 2 0.32 0.35 0.37 0.39 042 0.47 0.51 0.58 0.60 0.62 0.65 0.68 0.75 0.25 0.40 0.48 0.55 0.56 0.58 0.60 0.65 0.70 0.76 0.80 0.91 0.99 (a) Construct boxplots of the two sets of data. Compare the whisker lengths in the box plots of...
Use the Data for Two Stocks to determine the following: Create a one-way data table that...
Use the Data for Two Stocks to determine the following: Create a one-way data table that determines the different means and standard deviations for portfolios consisting of combinations of Stock A and Stock B by varying the correlation coefficient value between Stock A and Stock B through the full range of possible correlation coefficient values. Use increments of 0.1 for the possible correlation coefficient values. Graph the means and the standard deviations of the portfolios from the one-way data table....
R programming Language Problem 1. Create three vectors, each containing 20 values randomly sampled from a...
R programming Language Problem 1. Create three vectors, each containing 20 values randomly sampled from a normal distribution. The first should be from a normal distribution with mean = 0 and standard deviation = 1 (a.k.a. the standard normal distribution). The second should be from a normal distribution with mean = 10 and standard deviation = 1. The third should be from a normal distribution with mean = 10 and standard deviation = 10. Use the mean() and sd() functions...
solve the following questions Raw data is organized into a frequency table. Why would the raw...
 solve the following questions
Raw data is organized into a frequency table. Why would the raw data to differ from the mean of the frequency table? 13. we expect the mean of 14. mode, but different standard deviations Create two data sets, each with n = 5, that have the same mean, median, and 15. Construct a data set for which N = 7, u = 9, a = 0 16. Graphical Reasoning Both data sets shown in the stem-and-leaf...
solve the following questions
Raw data is organized into a frequency table. Why would the raw data to differ from the mean of the frequency table? 13. we expect the mean of 14. mode, but different standard deviations Create two data sets, each with n = 5, that have the same mean, median, and 15. Construct a data set for which N = 7, u = 9, a = 0 16. Graphical Reasoning Both data sets shown in the stem-and-leaf...
Part Two: Create a box and whisker plot and identify the outliers for the following data...
Part Two: Create a box and whisker plot and identify the outliers for the following data sets 4 and 5 Data Set 4 12, 72, 10, 13, 9, 11, 13, 12, 8, 15. Data Set 5 88, 89, 87, 92, 15, 85, 95, 98, 100, 90.
1.47 Means and SDs. For each part, compare distributions (1) and (2) based on their means and sta...
 1.47 Means and SDs. For each part, compare distributions (1) and (2) based on their means and standard deviations. You do not need to calculate these statistics; simply state how the means and the standard deviations compare. Make sure to explain your reasoning. Hint: It may be useful to sketch dot plots of the distributions. (a) (1) 3, 5, 5, 5, 8, 11, 11, 11, 13 (2) 3, 5, 5, 5, 8, 11, ії, 11, 20 (c) (1) 0, 2,...
 How are the two distributions different?
 -3 -2 -1 2 A and B are not significantly different A and B have different standard deviations and means A and B have different mean values A and B ha ve different standard deviations
How are the two distributions different?
How are the two distributions different? -3 -2 -1 2 A and B are not significantly different A and B have different standard deviations and means A and B have different mean values A and B ha ve different standard deviations
 Means and SDs For each part, compare distributions (1) and (2) based on their means and standard deviations. You do not need to calculate these statistics; simply state how the means and the standard deviations compare. You will need to look at Exercise 1.47 in OpenIntro Statistics to answer these questions There are two correct answers to each part below; select them both. 1.47 Means and SDs. For each part, compare distributions (1) and (2) based on their means and...
 2. Comparing smaller data sets using box plots Two data sets describing the fraction of protein recovered from thirteen test samples by each of two different methods are given in the table below Method1 Method 2 0.32 0.35 0.37 0.39 042 0.47 0.51 0.58 0.60 0.62 0.65 0.68 0.75 0.25 0.40 0.48 0.55 0.56 0.58 0.60 0.65 0.70 0.76 0.80 0.91 0.99 (a) Construct boxplots of the two sets of data. Compare the whisker lengths in the box plots of...
 solve the following questions
Raw data is organized into a frequency table. Why would the raw data to differ from the mean of the frequency table? 13. we expect the mean of 14. mode, but different standard deviations Create two data sets, each with n = 5, that have the same mean, median, and 15. Construct a data set for which N = 7, u = 9, a = 0 16. Graphical Reasoning Both data sets shown in the stem-and-leaf...
solve the following questions
Raw data is organized into a frequency table. Why would the raw data to differ from the mean of the frequency table? 13. we expect the mean of 14. mode, but different standard deviations Create two data sets, each with n = 5, that have the same mean, median, and 15. Construct a data set for which N = 7, u = 9, a = 0 16. Graphical Reasoning Both data sets shown in the stem-and-leaf...
 1.47 Means and SDs. For each part, compare distributions (1) and (2) based on their means and standard deviations. You do not need to calculate these statistics; simply state how the means and the standard deviations compare. Make sure to explain your reasoning. Hint: It may be useful to sketch dot plots of the distributions. (a) (1) 3, 5, 5, 5, 8, 11, 11, 11, 13 (2) 3, 5, 5, 5, 8, 11, ії, 11, 20 (c) (1) 0, 2,...
Most questions answered within 3 hours.
-
Where is the error in this code sequence?
String s1 = "Hello";
String s2 = "ello";...
asked 11 months ago -
Financial data for Joel de Paris, Inc., for last year
follow:
Joel de Paris, Inc.
Balance...
asked 11 months ago -
Consider this reaction:
Al2(SO4)3 (aq)+ BaCl3
(aq) Al2Cl6 (aq)- +
3BaSO4(s) . What is the...
asked 11 months ago -
Suppose that Savneet is considering increasing her
recent random sample from 20 car rentals to 40...
asked 11 months ago -
Trucks arrive at an unloading terminal at an average rate of 120
per hour.
Trucks arrive...
asked 11 months ago -
Why are methanol and ethanol completely soluble in water while
octanol is not very little soluble....
asked 11 months ago -
A facilities manager at a university reads in a research report
that the mean amount of...
asked 11 months ago -
When the CuSO4 is rehydrated by adding water to the anhydrous
compound, is this an endothermic...
asked 11 months ago -
A ray of sunlight is passing from diamond into crown glass; the
angle of incidence is...
asked 11 months ago -
A block of mass 0.249 kg is placed on top of a light, vertical
spring of...
asked 11 months ago -
how do the kidneys compensate in the presences of acidosis
a) trigger hyperventilate
b) reserve acid...
asked 11 months ago -
Question 501 pts
The rental rate of capital to the firm increases. Which of the
following...
asked 11 months ago