R programming Language Problem 1. Create three vectors, each containing 20 values randomly sampled from a...
R programming Language Problem
1. Create three vectors, each containing 20 values randomly sampled from a normal distribution. The first should be from a normal distribution with mean = 0 and standard deviation = 1 (a.k.a. the standard normal distribution). The second should be from a normal distribution with mean = 10 and standard deviation = 1. The third should be from a normal distribution with mean = 10 and standard deviation = 10.
Use the mean() and sd() functions in R to check the means and standard deviations for each of your three vectors. Why don’t these have the exact same means and standard deviations as the distributions used to generate them? Do their means and standard deviations seem reasonable anyway? (For this problem, please have R display the values in all three vectors along with their means and standard deviations.)
2. For this problem, you will use R to simulate flipping a coin 25 times. Create a vector that contains two values, one for “heads” and one for “tails”. Then use the sample() function to randomly choose one of the two values in this vector, 25 times.
Homework Answers
1)
We create three vectors with 20 values each from the normal distribution using rnorm function. Then calculate the means and standard deviation and print them.
 The
output:
The
output:
 The observed means and standard
deviations aren't the exact same as the actual values. This is
because we have sampled only 20 values from the normal
distributions hence there is some amount of error introduced when
we compute the means and std from the vectors. Increasing the
number of values sampled to a much higher number should reduce the
error observed
The observed means and standard
deviations aren't the exact same as the actual values. This is
because we have sampled only 20 values from the normal
distributions hence there is some amount of error introduced when
we compute the means and std from the vectors. Increasing the
number of values sampled to a much higher number should reduce the
error observed
R Code.
a = rnorm(20, mean=0, sd=1)
b = rnorm(20, mean=10, sd=1)
c = rnorm(20, mean=10, sd=10)
mean_a = mean(a)
sd_a = sd(a)
mean_b = mean(b)
sd_b = sd(b)
mean_c = mean(c)
sd_c = sd(c)
print(paste("Mean, standard deviation of 1st vector: ",
toString(mean_a), toString(sd_a)))
print(paste("Mean, standard deviation of 2nd vector: ",
toString(mean_b), toString(sd_b)))
print(paste("Mean, standard deviation of 3rd vector: ",
toString(mean_c), toString(sd_c)))
2) We simulate the coin flip 25 times using a binomial distribution. Use the rbinom() function to do so. It takes 3 arguments, 1st is the number of flips which is 25, then is the number of coins flipped which is 1, and the final one is probability of gettings heads which is 0.5 (assuming unbiased coin).
Then use the sample function, pass the coin vector and size as 25 to sample values 25 times.
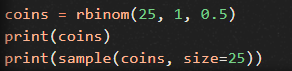
Output

R Code
coins = rbinom(25, 1, 0.5)
print(coins)
print(sample(coins, size=25))
Add Answer to:
R programming Language Problem
1. Create three vectors, each containing 20 values randomly
sampled from a...
R problem 1: The reason that the t distribution is important is that the sampling distribution...
 R problem 1: The reason that the t distribution is important is that the sampling distribution of the standardized sample mean is different depending on whether we use the true population standard deviation or one estimated from sample data. This problem addresses this issue. 1. Generate 10,000 samples of size n- 4 from a normal distribution with mean 100 and standard deviation σ = 12, Find the 10,000 sample means and find the 10,000 sample standard deviations. What are the...
1. Three randomly selected households are surveyed. The numbers of people in the households are 3, 4 and 11. Assume that samples of size n=2 are randomly selected with replacement from the populatio...
1. Three randomly selected households are surveyed. The numbers of people in the households are 3, 4 and 11. Assume that samples of size n=2 are randomly selected with replacement from the population of3, 4, and 11. Listed below are the nine different samples. Complete parts (a) through (c).3,3 3,4 3,11 4,3 4,4 4,11 11,3 11,4 11,11a. Find the variance of each of the nine samples, then summarize the sampling distribution of the variances in the format of a table...
R-Studio (R Programming Language) 5. Create and store a sequence of values from 6 to -8...
R-Studio (R Programming Language) 5. Create and store a sequence of values from 6 to -8 that progresses in steps of 0.4, name it `xseq` ```{r} #insert your code ``` 6. reverse the order of `xseq` using `sort` function. ```{r} #insert your code ``` 7. Repeat the vector `c(-1,2,-3,4,-5)` twice, with each element repeated 7 times, and store the result in `xrep`. Display the result sorted from largest to smallest.
Problem 2: The turnbuckle is tightened until the tension in cable AE is 8kN. Create proper R-vectors for three cables A...
 Problem 2: The turnbuckle is tightened until the tension in cable AE is 8kN. Create proper R-vectors for three cables AB, AC and AD. Develop three force vectors using R-vectors (unitize R-vectors). Show three EOE that you will solve to find tensions in AB, Be and CB. Show RREF matrix that you will use to solve for tensions. Show all tensions on an FBD with values AC 2.5 m 2 m D ECODS,a.) 2.5 m & KN EX 2.5 m...
R Programming Exercise Book Problem 57 (Difficulty: Easy) A normal distribution has a standard deviation of...
R Programming Exercise Book Problem 57 (Difficulty: Easy) A normal distribution has a standard deviation of 35 and mean of 15. From this generate 2 to 400 samples. After generating the samples utilize the plot command to plot the mean of the generated sample (x-axis) against the number of samples. Create a second plot of the density of the 400 samples that you generated. This code can be solved in 4 to 8 lines. For this problem use the following...
The following is a multi-part problem, report the r code used for the following 1. Obtain...
The following is a multi-part problem, report the r code used for the following 1. Obtain 854 values at random from a uniform distribution where the smallest possible value is 10 and largest is 30. name the vector ex2. Consider ex2 the population. 2. Generate a histogram of ex2 3. Randomly obtain 7 samples with 10 observations in each sample from ex2 using sampling with replacement. Name the vector sam7. Calculate the mean for each sample and name that object...
Use Random number generator (under Data Analysis) to simulate the following data set. Create 10 columns, each 20 points...
Use Random number generator (under Data Analysis) to simulate the following data set. Create 10 columns, each 20 points long and use the following parameters: Number of variables (10), number of data point (20), Distribution (Normal), Mean (40), Standard Deviation (10), Random seed (1234). The data should be in columns: A,B,C,….,I,J. Randomly pick two columns (say Column B and Column H) and perform 2-sided t-test on these two data columns. Record the P-value and repeat this procedure several times (at...
Generate a random sample of 20,000 x values (based on a sample of size 30) from...
Generate a random sample of 20,000 x values (based on a sample of size 30) from a Normal distribution with a mean of 26 and a standard deviation of 5. Be sure to use 30116 as your seed. Find the approximate mean and standard deviation of the sampling distribution of the sample means (x) based on your simulation. No credit will be awarded for responses that do not include R code and output.
In this homework, you will receive a set of ten quantitative values for each of three...
In this homework, you will receive a set of ten quantitative values for each of three genotypes: aa, Aa, and AA. Here, A is the risk or increaser allele. We use the genotype codes 0, 1, and 2, corresponding to the number of A alleles in an individual's genotype. That is, we use the following table: GENOTYPE CODE GENOTYPE 0 aa 1 Aa 2 AA EXERCISES 1. For each genotype code's ten quantitative values, compute the mean and standard deviation....
Please use html format! II. The goal of this problem is to simulate the distribution of the sample mean. We will...
 Please use html format!
II. The goal of this problem is to simulate the distribution of the sample mean. We will use the buit load the dataset and avoid some problems, copy and paste the following command in dataset 1ynx. To lynx as.numeric(lynx) Assume this vector represents the population. Le, the mean of this vector is our "true mean" (a) Draw a histogram of the population, find the "true" mean, and the true" variance. Does this data look normally distributed?...
Please use html format!
II. The goal of this problem is to simulate the distribution of the sample mean. We will use the buit load the dataset and avoid some problems, copy and paste the following command in dataset 1ynx. To lynx as.numeric(lynx) Assume this vector represents the population. Le, the mean of this vector is our "true mean" (a) Draw a histogram of the population, find the "true" mean, and the true" variance. Does this data look normally distributed?...
 R problem 1: The reason that the t distribution is important is that the sampling distribution of the standardized sample mean is different depending on whether we use the true population standard deviation or one estimated from sample data. This problem addresses this issue. 1. Generate 10,000 samples of size n- 4 from a normal distribution with mean 100 and standard deviation σ = 12, Find the 10,000 sample means and find the 10,000 sample standard deviations. What are the...
 Problem 2: The turnbuckle is tightened until the tension in cable AE is 8kN. Create proper R-vectors for three cables AB, AC and AD. Develop three force vectors using R-vectors (unitize R-vectors). Show three EOE that you will solve to find tensions in AB, Be and CB. Show RREF matrix that you will use to solve for tensions. Show all tensions on an FBD with values AC 2.5 m 2 m D ECODS,a.) 2.5 m & KN EX 2.5 m...
 Please use html format!
II. The goal of this problem is to simulate the distribution of the sample mean. We will use the buit load the dataset and avoid some problems, copy and paste the following command in dataset 1ynx. To lynx as.numeric(lynx) Assume this vector represents the population. Le, the mean of this vector is our "true mean" (a) Draw a histogram of the population, find the "true" mean, and the true" variance. Does this data look normally distributed?...
Please use html format!
II. The goal of this problem is to simulate the distribution of the sample mean. We will use the buit load the dataset and avoid some problems, copy and paste the following command in dataset 1ynx. To lynx as.numeric(lynx) Assume this vector represents the population. Le, the mean of this vector is our "true mean" (a) Draw a histogram of the population, find the "true" mean, and the true" variance. Does this data look normally distributed?...
Most questions answered within 3 hours.
-
Where is the error in this code sequence?
String s1 = "Hello";
String s2 = "ello";...
asked 11 months ago -
Financial data for Joel de Paris, Inc., for last year
follow:
Joel de Paris, Inc.
Balance...
asked 11 months ago -
Consider this reaction:
Al2(SO4)3 (aq)+ BaCl3
(aq) Al2Cl6 (aq)- +
3BaSO4(s) . What is the...
asked 11 months ago -
Suppose that Savneet is considering increasing her
recent random sample from 20 car rentals to 40...
asked 11 months ago -
Trucks arrive at an unloading terminal at an average rate of 120
per hour.
Trucks arrive...
asked 11 months ago -
Why are methanol and ethanol completely soluble in water while
octanol is not very little soluble....
asked 11 months ago -
A facilities manager at a university reads in a research report
that the mean amount of...
asked 11 months ago -
When the CuSO4 is rehydrated by adding water to the anhydrous
compound, is this an endothermic...
asked 11 months ago -
A ray of sunlight is passing from diamond into crown glass; the
angle of incidence is...
asked 11 months ago -
A block of mass 0.249 kg is placed on top of a light, vertical
spring of...
asked 11 months ago -
how do the kidneys compensate in the presences of acidosis
a) trigger hyperventilate
b) reserve acid...
asked 11 months ago -
Question 501 pts
The rental rate of capital to the firm increases. Which of the
following...
asked 11 months ago