


Homework Answers


Add Answer to:
Means and SDs For each part, compare distributions (1) and (2) based on their means and...
1.47 Means and SDs. For each part, compare distributions (1) and (2) based on their means and sta...
 1.47 Means and SDs. For each part, compare distributions (1) and (2) based on their means and standard deviations. You do not need to calculate these statistics; simply state how the means and the standard deviations compare. Make sure to explain your reasoning. Hint: It may be useful to sketch dot plots of the distributions. (a) (1) 3, 5, 5, 5, 8, 11, 11, 11, 13 (2) 3, 5, 5, 5, 8, 11, ії, 11, 20 (c) (1) 0, 2,...
For each part create two different data distributions ( data sets ) having the specified properties...
For each part create two different data distributions ( data sets ) having the specified properties by choosing nine values from the set {1, 2, 3, 4, 5} and construct a histogram of each of your two distributions. a- The two distributions have equal means but different standard deviations. b- The two distributions have different means but equal standard deviations. c- The two distributions have equal means and equal standard deviations (but the means need not equal the standard deviations)
points Means 8nd SDs. Fo each pert. com pe e derbutions A 8 d besed on...
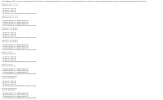 points Means 8nd SDs. Fo each pert. com pe e derbutions A 8 d besed on ther eens and stands d de asons You do not need to cele lent these ste s es s m py state how the tens and the stande d dev st ons compare H r许 ey be use to ske e do P s of he d at u on List B: 3. 5.5,5. 8, 11, 11, 11, 20 OA. mean ofA <mean of...
This Assignment worth 5 marks. Good Luck! 1) (1.5 marks) in a class of 25 students,...
 This Assignment worth 5 marks. Good Luck! 1) (1.5 marks) in a class of 25 students, 24 of them took an exam in class and 1 student took a make-up exam the following day. The professor graded the first batch of 24 exams and found an average score of 74 points with a standard deviation of 8.9 points. The student who took the make-up the following day scored 64 points on the exam. (a) Does the new student's score increase...
How are the two distributions different? How are the two distributions different? -3 -2 -1 2...
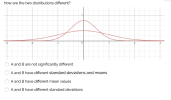 How are the two distributions different?
 -3 -2 -1 2 A and B are not significantly different A and B have different standard deviations and means A and B have different mean values A and B ha ve different standard deviations
How are the two distributions different?
How are the two distributions different? -3 -2 -1 2 A and B are not significantly different A and B have different standard deviations and means A and B have different mean values A and B ha ve different standard deviations
In the notes there is a Central Limit Theorem example in which a sampling distribution of means i...
 R Programming codes for the above questions?
In the notes there is a Central Limit Theorem example in which a sampling distribution of means is created using a for loop, and then this distribution is plotted. This distribution should look approximately like a normal distribution. However, not all statistics have normal sampling distributions. For this problem, you'll create a sampling distribution of standard deviations rather than means. 3. Using a for loop, draw 10,000 samples of size n-30 from a...
R Programming codes for the above questions?
In the notes there is a Central Limit Theorem example in which a sampling distribution of means is created using a for loop, and then this distribution is plotted. This distribution should look approximately like a normal distribution. However, not all statistics have normal sampling distributions. For this problem, you'll create a sampling distribution of standard deviations rather than means. 3. Using a for loop, draw 10,000 samples of size n-30 from a...
1) the distribution and histogram of individual penny dates for the entire class (this will be our population), Math/BSAD 2170 Sampling Distributions and Central Limit Theorem 2) the dis...
 1) the distribution and histogram of individual penny dates for the entire class (this will be our population), Math/BSAD 2170 Sampling Distributions and Central Limit Theorem 2) the distribution and histogram of the means from samples of 5 pennies (this is called a sampling distribution with n 5), 3) the distribution and histogram of the means from samples of 10 pennies (a sampling distribution with n 10), and 4) the distribution and histogram of the means of each sample of...
R programming Language Problem 1. Create three vectors, each containing 20 values randomly sampled from a...
R programming Language Problem 1. Create three vectors, each containing 20 values randomly sampled from a normal distribution. The first should be from a normal distribution with mean = 0 and standard deviation = 1 (a.k.a. the standard normal distribution). The second should be from a normal distribution with mean = 10 and standard deviation = 1. The third should be from a normal distribution with mean = 10 and standard deviation = 10. Use the mean() and sd() functions...
R problem 1: The reason that the t distribution is important is that the sampling distribution...
 R problem 1: The reason that the t distribution is important is that the sampling distribution of the standardized sample mean is different depending on whether we use the true population standard deviation or one estimated from sample data. This problem addresses this issue. 1. Generate 10,000 samples of size n- 4 from a normal distribution with mean 100 and standard deviation σ = 12, Find the 10,000 sample means and find the 10,000 sample standard deviations. What are the...
Part 2. (6 points) Normal Distributions Some companies "grade on a bell curve" to compare the...
Part 2. (6 points) Normal Distributions Some companies "grade on a bell curve" to compare the performance of their managers and professional workers. This forces the use of some low performance ratings so that not all workers are listed as "above average." Ford Motor Company's "performance management process" for this year assigned 10% A grades, 80% B grades, and 10% C grades to the company's managers. Suppose Ford's performance scores really are Normally distributed. This year, managers with scores less...
 1.47 Means and SDs. For each part, compare distributions (1) and (2) based on their means and standard deviations. You do not need to calculate these statistics; simply state how the means and the standard deviations compare. Make sure to explain your reasoning. Hint: It may be useful to sketch dot plots of the distributions. (a) (1) 3, 5, 5, 5, 8, 11, 11, 11, 13 (2) 3, 5, 5, 5, 8, 11, ії, 11, 20 (c) (1) 0, 2,...
 points Means 8nd SDs. Fo each pert. com pe e derbutions A 8 d besed on ther eens and stands d de asons You do not need to cele lent these ste s es s m py state how the tens and the stande d dev st ons compare H r许 ey be use to ske e do P s of he d at u on List B: 3. 5.5,5. 8, 11, 11, 11, 20 OA. mean ofA <mean of...
 This Assignment worth 5 marks. Good Luck! 1) (1.5 marks) in a class of 25 students, 24 of them took an exam in class and 1 student took a make-up exam the following day. The professor graded the first batch of 24 exams and found an average score of 74 points with a standard deviation of 8.9 points. The student who took the make-up the following day scored 64 points on the exam. (a) Does the new student's score increase...
 How are the two distributions different?
 -3 -2 -1 2 A and B are not significantly different A and B have different standard deviations and means A and B have different mean values A and B ha ve different standard deviations
How are the two distributions different?
How are the two distributions different? -3 -2 -1 2 A and B are not significantly different A and B have different standard deviations and means A and B have different mean values A and B ha ve different standard deviations
 R Programming codes for the above questions?
In the notes there is a Central Limit Theorem example in which a sampling distribution of means is created using a for loop, and then this distribution is plotted. This distribution should look approximately like a normal distribution. However, not all statistics have normal sampling distributions. For this problem, you'll create a sampling distribution of standard deviations rather than means. 3. Using a for loop, draw 10,000 samples of size n-30 from a...
R Programming codes for the above questions?
In the notes there is a Central Limit Theorem example in which a sampling distribution of means is created using a for loop, and then this distribution is plotted. This distribution should look approximately like a normal distribution. However, not all statistics have normal sampling distributions. For this problem, you'll create a sampling distribution of standard deviations rather than means. 3. Using a for loop, draw 10,000 samples of size n-30 from a...
 1) the distribution and histogram of individual penny dates for the entire class (this will be our population), Math/BSAD 2170 Sampling Distributions and Central Limit Theorem 2) the distribution and histogram of the means from samples of 5 pennies (this is called a sampling distribution with n 5), 3) the distribution and histogram of the means from samples of 10 pennies (a sampling distribution with n 10), and 4) the distribution and histogram of the means of each sample of...
 R problem 1: The reason that the t distribution is important is that the sampling distribution of the standardized sample mean is different depending on whether we use the true population standard deviation or one estimated from sample data. This problem addresses this issue. 1. Generate 10,000 samples of size n- 4 from a normal distribution with mean 100 and standard deviation σ = 12, Find the 10,000 sample means and find the 10,000 sample standard deviations. What are the...
Most questions answered within 3 hours.
-
Where is the error in this code sequence?
String s1 = "Hello";
String s2 = "ello";...
asked 11 months ago -
Financial data for Joel de Paris, Inc., for last year
follow:
Joel de Paris, Inc.
Balance...
asked 11 months ago -
Consider this reaction:
Al2(SO4)3 (aq)+ BaCl3
(aq) Al2Cl6 (aq)- +
3BaSO4(s) . What is the...
asked 11 months ago -
Suppose that Savneet is considering increasing her
recent random sample from 20 car rentals to 40...
asked 11 months ago -
Trucks arrive at an unloading terminal at an average rate of 120
per hour.
Trucks arrive...
asked 11 months ago -
Why are methanol and ethanol completely soluble in water while
octanol is not very little soluble....
asked 11 months ago -
A facilities manager at a university reads in a research report
that the mean amount of...
asked 11 months ago -
When the CuSO4 is rehydrated by adding water to the anhydrous
compound, is this an endothermic...
asked 11 months ago -
A ray of sunlight is passing from diamond into crown glass; the
angle of incidence is...
asked 11 months ago -
A block of mass 0.249 kg is placed on top of a light, vertical
spring of...
asked 11 months ago -
how do the kidneys compensate in the presences of acidosis
a) trigger hyperventilate
b) reserve acid...
asked 11 months ago -
Question 501 pts
The rental rate of capital to the firm increases. Which of the
following...
asked 11 months ago