
Homework Answers

Problem 1: Consider the continuous-time signal r(t) as shown in Figure 1. r(t) Figure 1: A...
 Problem 1: Consider the continuous-time signal r(t) as shown in Figure 1. r(t) Figure 1: A continuous-time signal r(t) (a) Determine the fundamental period and the fundamental angular frequency of r(). 5 (b) Write down the equation for z(0) as the Fourier Series in exponential form and identify (c) Sketch the spectrum of this signal indicating the complex amplitudes and the frequen- points the Fourier Series coefficients. (15 points cies. [10 points
Create chart or table Consider the system with the impulse response ht)e u(t), as shown in Figure...
 Create chart or table Consider the system with the impulse response ht)e u(t), as shown in Figure 3.2(a). This system's response to an input of x(t) 1) would be y(t) h(r ult 1). as shown in Figure 3.2(b). If the input signal is a sum of weighted, time-shifted impulses as described by (3.10), separated in time by Δ = 0.1 (s) so that xt)01-0.1k), as shown in Figure 3.2(c), then, according to (3.11), the output is This output signal is...
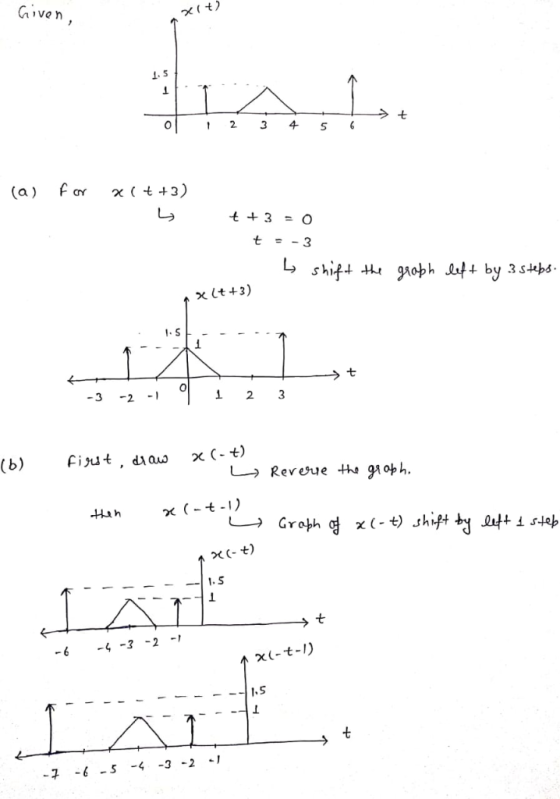
7 Draw the continuous time signal. x(t)={r(t)-r(t-2)-r(t-4)+r(t-6)}+{u(t+4)-2u(t+2)+2u(t)-u(t-6)} where [u(t) is unit step signal and r(t) is...
 7 Draw the continuous time signal. x(t)={r(t)-r(t-2)-r(t-4)+r(t-6)}+{u(t+4)-2u(t+2)+2u(t)-u(t-6)} where [u(t) is unit step signal and r(t) is unit ramp signal]. And sketch the following i. yl(t)=x[-1-2) ii. y2(t)=x[3-t] 15 Marks
Please show using MATLAB Answer 7. Obtain the convolution of the pairs of signals in Figure 7 h(t) a(t) 0 2 h(t) r(t) 0 0 Figure 7: Signal pairs Therefore, y(t) = 0 otherwise 7. Obtain the convol...
 Please show using MATLAB Answer
7. Obtain the convolution of the pairs of signals in Figure 7 h(t) a(t) 0 2 h(t) r(t) 0 0 Figure 7: Signal pairs Therefore, y(t) = 0 otherwise
7. Obtain the convolution of the pairs of signals in Figure 7 h(t) a(t) 0 2 h(t) r(t) 0 0 Figure 7: Signal pairs
Therefore, y(t) = 0 otherwise
Please show using MATLAB Answer
7. Obtain the convolution of the pairs of signals in Figure 7 h(t) a(t) 0 2 h(t) r(t) 0 0 Figure 7: Signal pairs Therefore, y(t) = 0 otherwise
7. Obtain the convolution of the pairs of signals in Figure 7 h(t) a(t) 0 2 h(t) r(t) 0 0 Figure 7: Signal pairs
Therefore, y(t) = 0 otherwise
1. Suppose x(t) -3u(t+3) - u(t)+ 3H(t-3) - 5H(t-6) a. Sketch x(t). b. For the signal x(t) given, ...
 I need a Matlab code example plz
1. Suppose x(t) -3u(t+3) - u(t)+ 3H(t-3) - 5H(t-6) a. Sketch x(t). b. For the signal x(t) given, determine and sketch the following signals: ,g(t) x(t-6) g2(t) - x(3t-6) ii. s(t) x(3t-6) +2 c. Create a MATLAB script that uses a function to express x(t), and plots x(t) in the time interval- 5 < t < 8s, using a time increment of At= 0.01s. Next, use the function to graph each of the...
I need a Matlab code example plz
1. Suppose x(t) -3u(t+3) - u(t)+ 3H(t-3) - 5H(t-6) a. Sketch x(t). b. For the signal x(t) given, determine and sketch the following signals: ,g(t) x(t-6) g2(t) - x(3t-6) ii. s(t) x(3t-6) +2 c. Create a MATLAB script that uses a function to express x(t), and plots x(t) in the time interval- 5 < t < 8s, using a time increment of At= 0.01s. Next, use the function to graph each of the...
1. Create the following signals, f1, f2 in time domain. t = 0 to 1 second....
1. Create the following signals, f1, f2 in time domain. t = 0 to 1 second. f1(t) = 8 sin (2 *pi*80*t); f2(t) = 4 cos (2*pi*240*t) Define any assumptions you make to generate the signals. 2. Plot the two graphs as sub plots with appropriate lables in x axis (time), y axis, title etc. 3. Generate the following signal f3 = f1 + f2; 4. Plot as sub plot in (2). 5. Compute the fourier transform of this signal,...
2. For the signal shown in figure, draw the following signals x(t) 2 1 -1 0...
 2. For the signal shown in figure, draw the following signals x(t) 2 1 -1 0 1 2 a. x(t-5) b. x(2t+1) C. x(6-t) d. x(-t-2) e. [x(t)+x(-t)Ju(t) 3. Given x[n]=(6-1)[[n] -u[n-6]], draw the following signals a. X[n+3] b. X[3n+1] c. X[6-n) d. x 4. Draw the following signals a. X(t)=u(sin st) b. X(t)=u(t+1)-2u(t)+u(t-1) c. X(t)=r(++4)-r(1+2)+u(t)-3r(1-4)+3r(1-5) d. x(t)=2u(t)-u(1-2)+1(1-3)-2r(1-4)+2r(1-5)
Problem 3. 0 Figure 2 Given: f(t) = { 2.5, -1.5 <=<= 1.5 f(t) = {...
 Problem 3. 0 Figure 2 Given: f(t) = { 2.5, -1.5 <=<= 1.5 f(t) = { 0 otherwise See figure(2) above. A) Find the Fourier transform for f( (see figure 2) and sketch its waveform. B) Determine the values of the first three frequency terms (w1, W2, W3) where F(w) = 0. C) Given x(t) = 1.58(-0.8) edt Determine whether or not Fourier transform exists for x(t). If yes, find the Fourier transfe not explain why it does not. Problem...
1. Using the Fourier series analysis Equation 3 for the periodic function r(t) shown in Figure 2....
 1. Using the Fourier series analysis Equation 3 for the periodic function r(t) shown in Figure 2.1, determine both the DC coefficient ao and a general expression for the other Fourier series coefficients ak. Do this by hand, not in Matlab. Show all your work in your lab report. You can add these pages as hand-written pages, rather than typing them in to your lab report, if you prefer Hint 1: It will be easiest to integrate this function from...
Find K r" = kt r = 1 t = 0 r = 2 t =3...
 Find K
r" = kt
r = 1 t = 0
r = 2 t =3
Imagine that you are an engineer working in à mahufaclug created a machine that is used to adhere one part to another. Figure 2 shows Part A being adhered to Part B. You will assume that you have constrained the manipulator such that 0 for all time. Additionally, you will control the acceleration of the end-point of the manipulator, and this expression is given...
Find K
r" = kt
r = 1 t = 0
r = 2 t =3
Imagine that you are an engineer working in à mahufaclug created a machine that is used to adhere one part to another. Figure 2 shows Part A being adhered to Part B. You will assume that you have constrained the manipulator such that 0 for all time. Additionally, you will control the acceleration of the end-point of the manipulator, and this expression is given...
 Problem 1: Consider the continuous-time signal r(t) as shown in Figure 1. r(t) Figure 1: A continuous-time signal r(t) (a) Determine the fundamental period and the fundamental angular frequency of r(). 5 (b) Write down the equation for z(0) as the Fourier Series in exponential form and identify (c) Sketch the spectrum of this signal indicating the complex amplitudes and the frequen- points the Fourier Series coefficients. (15 points cies. [10 points
 Create chart or table Consider the system with the impulse response ht)e u(t), as shown in Figure 3.2(a). This system's response to an input of x(t) 1) would be y(t) h(r ult 1). as shown in Figure 3.2(b). If the input signal is a sum of weighted, time-shifted impulses as described by (3.10), separated in time by Δ = 0.1 (s) so that xt)01-0.1k), as shown in Figure 3.2(c), then, according to (3.11), the output is This output signal is...
 7 Draw the continuous time signal. x(t)={r(t)-r(t-2)-r(t-4)+r(t-6)}+{u(t+4)-2u(t+2)+2u(t)-u(t-6)} where [u(t) is unit step signal and r(t) is unit ramp signal]. And sketch the following i. yl(t)=x[-1-2) ii. y2(t)=x[3-t] 15 Marks
 Please show using MATLAB Answer
7. Obtain the convolution of the pairs of signals in Figure 7 h(t) a(t) 0 2 h(t) r(t) 0 0 Figure 7: Signal pairs Therefore, y(t) = 0 otherwise
7. Obtain the convolution of the pairs of signals in Figure 7 h(t) a(t) 0 2 h(t) r(t) 0 0 Figure 7: Signal pairs
Therefore, y(t) = 0 otherwise
Please show using MATLAB Answer
7. Obtain the convolution of the pairs of signals in Figure 7 h(t) a(t) 0 2 h(t) r(t) 0 0 Figure 7: Signal pairs Therefore, y(t) = 0 otherwise
7. Obtain the convolution of the pairs of signals in Figure 7 h(t) a(t) 0 2 h(t) r(t) 0 0 Figure 7: Signal pairs
Therefore, y(t) = 0 otherwise
 I need a Matlab code example plz
1. Suppose x(t) -3u(t+3) - u(t)+ 3H(t-3) - 5H(t-6) a. Sketch x(t). b. For the signal x(t) given, determine and sketch the following signals: ,g(t) x(t-6) g2(t) - x(3t-6) ii. s(t) x(3t-6) +2 c. Create a MATLAB script that uses a function to express x(t), and plots x(t) in the time interval- 5 < t < 8s, using a time increment of At= 0.01s. Next, use the function to graph each of the...
I need a Matlab code example plz
1. Suppose x(t) -3u(t+3) - u(t)+ 3H(t-3) - 5H(t-6) a. Sketch x(t). b. For the signal x(t) given, determine and sketch the following signals: ,g(t) x(t-6) g2(t) - x(3t-6) ii. s(t) x(3t-6) +2 c. Create a MATLAB script that uses a function to express x(t), and plots x(t) in the time interval- 5 < t < 8s, using a time increment of At= 0.01s. Next, use the function to graph each of the...
 2. For the signal shown in figure, draw the following signals x(t) 2 1 -1 0 1 2 a. x(t-5) b. x(2t+1) C. x(6-t) d. x(-t-2) e. [x(t)+x(-t)Ju(t) 3. Given x[n]=(6-1)[[n] -u[n-6]], draw the following signals a. X[n+3] b. X[3n+1] c. X[6-n) d. x 4. Draw the following signals a. X(t)=u(sin st) b. X(t)=u(t+1)-2u(t)+u(t-1) c. X(t)=r(++4)-r(1+2)+u(t)-3r(1-4)+3r(1-5) d. x(t)=2u(t)-u(1-2)+1(1-3)-2r(1-4)+2r(1-5)
 Problem 3. 0 Figure 2 Given: f(t) = { 2.5, -1.5 <=<= 1.5 f(t) = { 0 otherwise See figure(2) above. A) Find the Fourier transform for f( (see figure 2) and sketch its waveform. B) Determine the values of the first three frequency terms (w1, W2, W3) where F(w) = 0. C) Given x(t) = 1.58(-0.8) edt Determine whether or not Fourier transform exists for x(t). If yes, find the Fourier transfe not explain why it does not. Problem...
 1. Using the Fourier series analysis Equation 3 for the periodic function r(t) shown in Figure 2.1, determine both the DC coefficient ao and a general expression for the other Fourier series coefficients ak. Do this by hand, not in Matlab. Show all your work in your lab report. You can add these pages as hand-written pages, rather than typing them in to your lab report, if you prefer Hint 1: It will be easiest to integrate this function from...
 Find K
r" = kt
r = 1 t = 0
r = 2 t =3
Imagine that you are an engineer working in à mahufaclug created a machine that is used to adhere one part to another. Figure 2 shows Part A being adhered to Part B. You will assume that you have constrained the manipulator such that 0 for all time. Additionally, you will control the acceleration of the end-point of the manipulator, and this expression is given...
Find K
r" = kt
r = 1 t = 0
r = 2 t =3
Imagine that you are an engineer working in à mahufaclug created a machine that is used to adhere one part to another. Figure 2 shows Part A being adhered to Part B. You will assume that you have constrained the manipulator such that 0 for all time. Additionally, you will control the acceleration of the end-point of the manipulator, and this expression is given...
Most questions answered within 3 hours.
-
Where is the error in this code sequence?
String s1 = "Hello";
String s2 = "ello";...
asked 10 months ago -
Financial data for Joel de Paris, Inc., for last year
follow:
Joel de Paris, Inc.
Balance...
asked 10 months ago -
Consider this reaction:
Al2(SO4)3 (aq)+ BaCl3
(aq) Al2Cl6 (aq)- +
3BaSO4(s) . What is the...
asked 10 months ago -
Suppose that Savneet is considering increasing her
recent random sample from 20 car rentals to 40...
asked 10 months ago -
Trucks arrive at an unloading terminal at an average rate of 120
per hour.
Trucks arrive...
asked 10 months ago -
Why are methanol and ethanol completely soluble in water while
octanol is not very little soluble....
asked 10 months ago -
A facilities manager at a university reads in a research report
that the mean amount of...
asked 10 months ago -
When the CuSO4 is rehydrated by adding water to the anhydrous
compound, is this an endothermic...
asked 10 months ago -
A ray of sunlight is passing from diamond into crown glass; the
angle of incidence is...
asked 10 months ago -
A block of mass 0.249 kg is placed on top of a light, vertical
spring of...
asked 10 months ago -
how do the kidneys compensate in the presences of acidosis
a) trigger hyperventilate
b) reserve acid...
asked 10 months ago -
Question 501 pts
The rental rate of capital to the firm increases. Which of the
following...
asked 10 months ago