

Homework Answers
| Location 1 | Location 2 | |
| 30.4 | 30.1 | |
| 30.2 | 30.9 | |
| 30.3 | 30.2 | |
| 30.4 | 30.7 | |
| 30.3 | 30.3 | |
| 0.08 | 0.34 | Stdev |
Use Excel function =STDEV.S(select the data)

_________________________
P-value = F.DIST.RT(18.06,4,4) = 0.007
p-value is less than 0.05 so, reject Ho we can conclude that the standard dev are not equal

______________________________________
| t-Test: Two-Sample Assuming Unequal Variances | ||
| Location 1 | Location 2 | |
| Mean | 30.32 | 30.44 |
| Variance | 0.007 | 0.118 |
| Observations | 5 | 5 |
| Hypothesized Mean Difference | 0 | |
| df | 4 | |
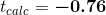
| t Stat | -0.76 | |
| P(T<=t) one-tail | 0.2450741 | |
| t Critical one-tail | 2.1318468 | |
| P(T<=t) two-tail | 0.4901481 | |
| t Critical two-tail | 2.7764451 | |

Since P-value is greater than 0.05
Add Answer to:
Sample To determine the organic material in a dried lake bed, the percent carbon by mass...
To determine the organic material in a dried lake bed, you have determined the percent carbon...
 To determine the organic material in a dried lake bed, you have determined the percent carbon by mass at two different locations. In order to compare the means of the two different locations, you need to determine whether the standard deviations of the two locations are different first. Location 1 Location 2 (90 C) 60.40 60.20 60.30 60.40 60.30 For each data set, calculate the standard deviation. (90 C) 60.10 60.80 60.20 60.80 60.40 Location 1 Location 2 2 3...
To delcrminc the organic matcrial in a dried lake hed, the percent carbon by mass is...
 To delcrminc the organic matcrial in a dried lake hed, the percent carbon by mass is mcasurod at two dilferent locations. Toc locations, it must lirst be detcrminod whcther the standard deviations of thc two locations arc dilferent compare thc mcans of the two dilferent (% C) 20.40 20.20 20.30 20.40 20.20 (% C) 20.10 20.90 20.30 20.80 20.40 For cach kocation, calculaic thc standard deviation and report it with two signilicant ligures. location I standard deviation: 0.10 location 2...
Method 01 (mM) 31.40 31.24 31.18 31.43 Method 02 (mM) 30.70 29.49 30.01 30.15 Sample a....
 Method 01 (mM) 31.40 31.24 31.18 31.43 Method 02 (mM) 30.70 29.49 30.01 30.15 Sample a. (4 pts) For each method, calculate the mean and standard deviation. b. (2 pts) Are the standard deviations significantly different at the 95% confidence level?
A blood sample was sent to two different Labs for cholesterol analysis and results are tabulated...
A blood sample was sent to two different Labs for cholesterol analysis and results are tabulated below: Lab Lab-1 (mg/100 mL) Lab-2 (mg/100 mL) Mean ± 243 258 Standard deviation s 15 13 # of measurments n 5 6 (i)Are the standard deviations s1 & s2 significantly different at 95% confidence level? (ii)Are the means s1 & s2 significantly different at 90% confidence level? (*Must use F-test and T-test to conclude above)
For the final project of an analytical chemistry laboratory course, the students were asked to quantify the lead (Pb2+) content in a drinking water sample. To receive a passing grade for the project,...
 For the final project of an analytical chemistry laboratory course, the students were asked to quantify the lead (Pb2+) content in a drinking water sample. To receive a passing grade for the project, the students must produce a result (Pb2 concentration) that agrees with the result obtained by the course professor, who was using the same method, at the 95% confidence level. The mean (x), standard deviation (Sy) and number of replicate measurements (n) are shown below for the data...
1. ANOVA is a statistical method for verifying the equality between some sample means b. a....
 1. ANOVA is a statistical method for verifying the equality between some sample means b. a. some sample standard deviations c. some population standard deviations d some population means Salary information regarding male and female employees of a large company is shown below Sample Size Male (Pop. 1) Female (Pop. 2) 49 47 Sample Mean Salary (in $1,000) , Population Variance 2. The point estimate of the difference μ-μ, between the two population means is Y 7-44-3.0 3. The margin...
When is unknown and the sample is of size n 230, there are two methods for...
 When is unknown and the sample is of size n 230, there are two methods for computing confidence intervals for u. (Notice that, When is unknown and the sample is of size n<30, there is only one method for constructing a confidence interval for the mean by using the student's t distribution with d.f. = n - 1.) Method 1: Use the Student's t distribution with d.f. = n - 1. This is the method used in the text. It...
Although the Canadian and U.S. one-cent coins have slightly different dimensions and alloy compositions the two...
 Although the Canadian and U.S. one-cent coins have slightly different dimensions and alloy compositions the two types of pennies have similar masses. The table below lists the masses of individual pennies from each country measured using the same balance. Compare the two sets of one-cent coins by determining calculated. Are the masses of the Canadian and U.S. one-cent coins significantly different at the 98% confidence level? The table of Student's t values can be found here. Assume that the population...
A random sample of 49 measurements from a population with population standard deviation o 3 had...
 A random sample of 49 measurements from a population with population standard deviation o 3 had a sample mean of x, 9. An independeent random sample of sample mean of x, 11. Test the claim that the population means are 64 measurements from a second population with population standard deviation a2 4 had different. Use level of significance 0.01. (a) What distribution does the sample test statistic follow? Explain. The student's t. We assume that both population distributions are approximately...
F-Test and corresponding t-Test for 95% confidence Three different methods were used to deterrmine the concentration...
 F-Test and corresponding t-Test for 95% confidence Three different methods were used to deterrmine the concentration of a certain bulk solution af acetic acid. The three methods were all titrations, using the same standard NaOH solution as titrant, and identical volumetric technique. The only difference was the choice of acid-base colour indicator to reveal the endpoint. For each method, the average acetic acid concentration and its standard deviation for the number of titrations (n) performed are summarized below IndicatorCH,COH+S (M)...
 To determine the organic material in a dried lake bed, you have determined the percent carbon by mass at two different locations. In order to compare the means of the two different locations, you need to determine whether the standard deviations of the two locations are different first. Location 1 Location 2 (90 C) 60.40 60.20 60.30 60.40 60.30 For each data set, calculate the standard deviation. (90 C) 60.10 60.80 60.20 60.80 60.40 Location 1 Location 2 2 3...
 To delcrminc the organic matcrial in a dried lake hed, the percent carbon by mass is mcasurod at two dilferent locations. Toc locations, it must lirst be detcrminod whcther the standard deviations of thc two locations arc dilferent compare thc mcans of the two dilferent (% C) 20.40 20.20 20.30 20.40 20.20 (% C) 20.10 20.90 20.30 20.80 20.40 For cach kocation, calculaic thc standard deviation and report it with two signilicant ligures. location I standard deviation: 0.10 location 2...
 Method 01 (mM) 31.40 31.24 31.18 31.43 Method 02 (mM) 30.70 29.49 30.01 30.15 Sample a. (4 pts) For each method, calculate the mean and standard deviation. b. (2 pts) Are the standard deviations significantly different at the 95% confidence level?
 For the final project of an analytical chemistry laboratory course, the students were asked to quantify the lead (Pb2+) content in a drinking water sample. To receive a passing grade for the project, the students must produce a result (Pb2 concentration) that agrees with the result obtained by the course professor, who was using the same method, at the 95% confidence level. The mean (x), standard deviation (Sy) and number of replicate measurements (n) are shown below for the data...
 1. ANOVA is a statistical method for verifying the equality between some sample means b. a. some sample standard deviations c. some population standard deviations d some population means Salary information regarding male and female employees of a large company is shown below Sample Size Male (Pop. 1) Female (Pop. 2) 49 47 Sample Mean Salary (in $1,000) , Population Variance 2. The point estimate of the difference μ-μ, between the two population means is Y 7-44-3.0 3. The margin...
 When is unknown and the sample is of size n 230, there are two methods for computing confidence intervals for u. (Notice that, When is unknown and the sample is of size n<30, there is only one method for constructing a confidence interval for the mean by using the student's t distribution with d.f. = n - 1.) Method 1: Use the Student's t distribution with d.f. = n - 1. This is the method used in the text. It...
 Although the Canadian and U.S. one-cent coins have slightly different dimensions and alloy compositions the two types of pennies have similar masses. The table below lists the masses of individual pennies from each country measured using the same balance. Compare the two sets of one-cent coins by determining calculated. Are the masses of the Canadian and U.S. one-cent coins significantly different at the 98% confidence level? The table of Student's t values can be found here. Assume that the population...
 A random sample of 49 measurements from a population with population standard deviation o 3 had a sample mean of x, 9. An independeent random sample of sample mean of x, 11. Test the claim that the population means are 64 measurements from a second population with population standard deviation a2 4 had different. Use level of significance 0.01. (a) What distribution does the sample test statistic follow? Explain. The student's t. We assume that both population distributions are approximately...
 F-Test and corresponding t-Test for 95% confidence Three different methods were used to deterrmine the concentration of a certain bulk solution af acetic acid. The three methods were all titrations, using the same standard NaOH solution as titrant, and identical volumetric technique. The only difference was the choice of acid-base colour indicator to reveal the endpoint. For each method, the average acetic acid concentration and its standard deviation for the number of titrations (n) performed are summarized below IndicatorCH,COH+S (M)...
Most questions answered within 3 hours.
-
Where is the error in this code sequence?
String s1 = "Hello";
String s2 = "ello";...
asked 10 months ago -
Financial data for Joel de Paris, Inc., for last year
follow:
Joel de Paris, Inc.
Balance...
asked 10 months ago -
Consider this reaction:
Al2(SO4)3 (aq)+ BaCl3
(aq) Al2Cl6 (aq)- +
3BaSO4(s) . What is the...
asked 10 months ago -
Suppose that Savneet is considering increasing her
recent random sample from 20 car rentals to 40...
asked 10 months ago -
Trucks arrive at an unloading terminal at an average rate of 120
per hour.
Trucks arrive...
asked 10 months ago -
Why are methanol and ethanol completely soluble in water while
octanol is not very little soluble....
asked 10 months ago -
A facilities manager at a university reads in a research report
that the mean amount of...
asked 10 months ago -
When the CuSO4 is rehydrated by adding water to the anhydrous
compound, is this an endothermic...
asked 10 months ago -
A ray of sunlight is passing from diamond into crown glass; the
angle of incidence is...
asked 10 months ago -
A block of mass 0.249 kg is placed on top of a light, vertical
spring of...
asked 10 months ago -
how do the kidneys compensate in the presences of acidosis
a) trigger hyperventilate
b) reserve acid...
asked 10 months ago -
Question 501 pts
The rental rate of capital to the firm increases. Which of the
following...
asked 10 months ago