
Homework Answers


Z critical value for 99% confidence level is 2.5758 (by using Z table) or =NORMSINV(1-(0.01/2))
Confidence interval formula
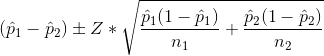

=>(-0.0288,0.2288)
Therefore, 99% confidence interval is (-0.0288, 0.2288)
Add Answer to:
Consider the following data from two independent samples. Construct a 99% confidence interval to estimate the...
are my answers correct? Consider the following data from two independent samples with equal population variances....
 are my answers
correct?
Consider the following data from two independent samples with equal population variances. Construct a 99% confidence interval to estimate the difference in population means. Assume the population variances are equal and that the populations are normally distributed x1 = 67.9 s1 = 12.8 n1 = 10 X2 74.8 s2 = 8.1 n2 = 14 Click here to see the t-distribution table, page 1 Click here to see the t-distribution table,_page 2 The 99% confidence interval is...
are my answers
correct?
Consider the following data from two independent samples with equal population variances. Construct a 99% confidence interval to estimate the difference in population means. Assume the population variances are equal and that the populations are normally distributed x1 = 67.9 s1 = 12.8 n1 = 10 X2 74.8 s2 = 8.1 n2 = 14 Click here to see the t-distribution table, page 1 Click here to see the t-distribution table,_page 2 The 99% confidence interval is...
Consider the following data from two independent samples with equal population variances. Construct a 99% confidence...
Consider the following data from two independent samples with equal population variances. Construct a 99% confidence interval to estimate the difference in population means. Assume the population variances are equal and that the populations are normally distributed. x overbar 1 equals= 37.1 x overbar 2 equals= 32.8 s 1 equals= 8.68 S2 equals= 9.59 N1 equals= 15 N2 equals= 16 The 99% confidence interval is ( )(. ).
Consider the data to the right from two independent samples. Construct a 90% confidence interval to...
Consider the data to the right from two independent samples. Construct a 90% confidence interval to estimate the difference in population means. x overbar 1 = 25 x overbar 2 = 24 sigma 1 = 7 sigma 2 = 6 n1= 40 n2 = 34 The confidence interval is? ___,____
Consider the data to the right from two independent samples. Construct a 90 % confidence interval...
Consider the data to the right from two independent samples. Construct a 90 % confidence interval to estimate the difference in population means.Click here to view page 1 of the standard normal table. LOADING... Click here to view page 2 of the standard normal table. LOADING... x overbar 1 equals 43 x overbar 2 equals 51 sigma 1 equals 10 sigma 2 equals 14 n 1 equals 35 n 2 equals 40 The confidence interval is left parenthesis nothing comma...
X11.1.15 Construct a confidence interval for p - p2 at the given level of confidence. X1...
 X11.1.15 Construct a confidence interval for p - p2 at the given level of confidence. X1 28, n1 236, x2 40, n2 308, 99% confidence % confident the difference between the two population proportions, p - P2. is between The researchers are and (Use ascending order. Type an integer or decimal rounded to three decimal places as needed.)
Consider two independent random samples with the following results: n1=123pˆ1=0.48 n2=367pˆ2=0.63 Use this data to find...
Consider two independent random samples with the following results: n1=123pˆ1=0.48 n2=367pˆ2=0.63 Use this data to find the 80% confidence interval for the true difference between the population proportions. Copy Data Step 1 of 3 : Find the point estimate that should be used in constructing the confidence interval. Step 2 of 3: Find the value of the margin of error. Round your answer to six decimal places. Step 3 of 3: Construct the 80% confidence interval. Round your answers to...
Construct the indicated confidence interval for the difference between population proportions p1- P2. Assume that the...
 Construct the indicated confidence interval for the difference between population proportions p1- P2. Assume that the samples are independent and that they have been randomly selected. X1 = 19, n1 = 46 and x2 = 25, n2 = 57; Construct a 90% confidence interval for the difference between population proportions P1 - P2. A) 0.252 < P1 - P2 < 0.574 OB) 0.221 < P1 - P2 < 0.605 C) 0.605 < P1 - P2 < 0.221 OD) -0.187 <...
Construct a 99% confidence interval to estimate the population mean using the data below. X =...
 Construct a 99% confidence interval to estimate the population mean using the data below. X = 46 o = 12 n42 With 99% confidence, when n = 42 the population mean is between a lower limit of (Round to two decimal places as needed.) and an upper limit of Construct a 95% confidence interval to estimate the population mean with X = 102 and o = 25 for the following sample sizes. a) n = 32 b) n = 45...
11. Construct the indicated confidence interval for the difference between population proportions. Assume that the samples...
 11. Construct the indicated confidence interval for the
difference between population proportions. Assume
that the samples are independent and that they have been randomly
selected.
A marketing survey involves product recognition in New York and
California. Of 558 New Yorkers surveyed, 193 knew the product while
196 out of 614 Californians knew the product. Construct a 99%
confidence interval for the difference between the two population
proportions.
12. Construct the indicated confidence interval for the
difference between population proportions. Assume...
11. Construct the indicated confidence interval for the
difference between population proportions. Assume
that the samples are independent and that they have been randomly
selected.
A marketing survey involves product recognition in New York and
California. Of 558 New Yorkers surveyed, 193 knew the product while
196 out of 614 Californians knew the product. Construct a 99%
confidence interval for the difference between the two population
proportions.
12. Construct the indicated confidence interval for the
difference between population proportions. Assume...
The following results come from two independent random samples taken of two populations. Sample 1 Sample...
The following results come from two independent random samples taken of two populations. Sample 1 Sample 2 n1 = 50 n2 = 35 x1 = 13.6 x2 = 11.6 σ1 = 2.4 σ2 = 3 What is the point estimate of the difference between the two population means? (Use x1 − x2.) (b) Provide a 90% confidence interval for the difference between the two population means. (Use x1 − x2. Round your answers to two decimal places.) (c) Provide a...
 are my answers
correct?
Consider the following data from two independent samples with equal population variances. Construct a 99% confidence interval to estimate the difference in population means. Assume the population variances are equal and that the populations are normally distributed x1 = 67.9 s1 = 12.8 n1 = 10 X2 74.8 s2 = 8.1 n2 = 14 Click here to see the t-distribution table, page 1 Click here to see the t-distribution table,_page 2 The 99% confidence interval is...
are my answers
correct?
Consider the following data from two independent samples with equal population variances. Construct a 99% confidence interval to estimate the difference in population means. Assume the population variances are equal and that the populations are normally distributed x1 = 67.9 s1 = 12.8 n1 = 10 X2 74.8 s2 = 8.1 n2 = 14 Click here to see the t-distribution table, page 1 Click here to see the t-distribution table,_page 2 The 99% confidence interval is...
 X11.1.15 Construct a confidence interval for p - p2 at the given level of confidence. X1 28, n1 236, x2 40, n2 308, 99% confidence % confident the difference between the two population proportions, p - P2. is between The researchers are and (Use ascending order. Type an integer or decimal rounded to three decimal places as needed.)
 Construct the indicated confidence interval for the difference between population proportions p1- P2. Assume that the samples are independent and that they have been randomly selected. X1 = 19, n1 = 46 and x2 = 25, n2 = 57; Construct a 90% confidence interval for the difference between population proportions P1 - P2. A) 0.252 < P1 - P2 < 0.574 OB) 0.221 < P1 - P2 < 0.605 C) 0.605 < P1 - P2 < 0.221 OD) -0.187 <...
 Construct a 99% confidence interval to estimate the population mean using the data below. X = 46 o = 12 n42 With 99% confidence, when n = 42 the population mean is between a lower limit of (Round to two decimal places as needed.) and an upper limit of Construct a 95% confidence interval to estimate the population mean with X = 102 and o = 25 for the following sample sizes. a) n = 32 b) n = 45...
 11. Construct the indicated confidence interval for the
difference between population proportions. Assume
that the samples are independent and that they have been randomly
selected.
A marketing survey involves product recognition in New York and
California. Of 558 New Yorkers surveyed, 193 knew the product while
196 out of 614 Californians knew the product. Construct a 99%
confidence interval for the difference between the two population
proportions.
12. Construct the indicated confidence interval for the
difference between population proportions. Assume...
11. Construct the indicated confidence interval for the
difference between population proportions. Assume
that the samples are independent and that they have been randomly
selected.
A marketing survey involves product recognition in New York and
California. Of 558 New Yorkers surveyed, 193 knew the product while
196 out of 614 Californians knew the product. Construct a 99%
confidence interval for the difference between the two population
proportions.
12. Construct the indicated confidence interval for the
difference between population proportions. Assume...
Most questions answered within 3 hours.
-
Where is the error in this code sequence?
String s1 = "Hello";
String s2 = "ello";...
asked 10 months ago -
Financial data for Joel de Paris, Inc., for last year
follow:
Joel de Paris, Inc.
Balance...
asked 10 months ago -
Consider this reaction:
Al2(SO4)3 (aq)+ BaCl3
(aq) Al2Cl6 (aq)- +
3BaSO4(s) . What is the...
asked 10 months ago -
Suppose that Savneet is considering increasing her
recent random sample from 20 car rentals to 40...
asked 10 months ago -
Trucks arrive at an unloading terminal at an average rate of 120
per hour.
Trucks arrive...
asked 10 months ago -
Why are methanol and ethanol completely soluble in water while
octanol is not very little soluble....
asked 10 months ago -
A facilities manager at a university reads in a research report
that the mean amount of...
asked 10 months ago -
When the CuSO4 is rehydrated by adding water to the anhydrous
compound, is this an endothermic...
asked 10 months ago -
A ray of sunlight is passing from diamond into crown glass; the
angle of incidence is...
asked 10 months ago -
A block of mass 0.249 kg is placed on top of a light, vertical
spring of...
asked 10 months ago -
how do the kidneys compensate in the presences of acidosis
a) trigger hyperventilate
b) reserve acid...
asked 10 months ago -
Question 501 pts
The rental rate of capital to the firm increases. Which of the
following...
asked 10 months ago