A company X added a new factory. The data contains the daily factory production for the...
A company X added a new factory. The data contains the daily factory production for the first six months. The researchers want to know whether the company is performing as well as the other companies. They also have an overall mean of the daily production output of the others factories. Which tool would you suggest to them?
a) Confidence Intervals
b) ANOVA
c) Correlation Matrix
d) Linear Regression
e) Histograms
f) CATNAP
Problem 4(2pts) ANOVA has been performed on some data. The output is below. Write three sentence report.

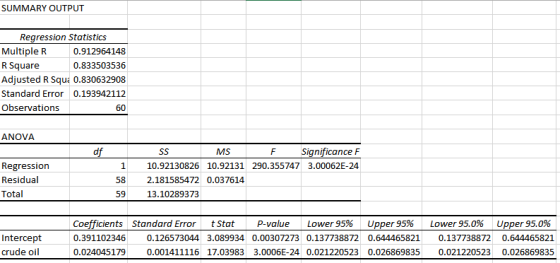
Problem 5(2pts) The linear regression method has been performed on the data trying to predict the price of the gas at the gas station using crude oil price. The results are below. Write a report.
Homework Answers

Add Answer to:
A company X added a new factory. The data contains the daily
factory production for the...
This problem asks you to consider a company refining crude oil into gasoline. The company hires...
This problem asks you to consider a company refining crude oil into gasoline. The company hires workers to process an input (crude oil) into an output (gasoline). You should assume both the (output) market for gasoline and the labor market for workers are perfectly competitive, and that the firm must pay the equilibrium wage set in the labor market and charge the equilibrium price for gas set in the market for gas. You may additionally assume the relevant labor market...
The Bendrix Company manufactures various types of parts for automobiles. The manager of the factory wants...
The Bendrix Company manufactures various types of parts for automobiles. The manager of the factory wants to get a better understanding of overhead costs. These overhead costs include supervision, indirect labor, supplies, payroll taxes, overtime premiums, depreciation, and a number of miscellaneous items such as insurance, utilities, and janitorial and maintenance expenses. Some of the overhead costs are “fixed” in the sense they do not vary appreciably with the volume of work being done, whereas others are “variable” and do...
Q3. A company in the field of fast moving consumer goods has launched several new products...
 Q3. A company in the field of fast moving consumer goods has launched several new products in recent years. The sales manager has to provide a forecast for sales in the next quarter. These forecasts are used to draw up an initial production plan, which is updated daily as new data becomes available. To provide these forecasts, the sales manager has conducted regression analysis but needs your advice on its interpretation. Extracts from the Excel regression analysis for products A...
Use Data Set D, Single Engine Aircraft Performance (Airplanes), on page 535 of your textbook to answer the following questions.
CruiseTotalHP1001162006002416501995701743001643601413601613001071101041451221601291801442301945701704202236202347501241801862851902851905001592351602351483101433001602001401252353501913101321251151801702101752441562001882801281601071251483001291801915001472352133501863001483001804401864401001501763001512609881163250143180Use Data Set D, Single Engine Aircraft Performance (Airplanes), on page 535 of your textbook to answer the following questions. The first column is X, or the independent variable and the second column is Y, or the dependent variable. Use MINITAB to obtain the simple regression equation, confidence interval, prediction interval, and required graphs. Insert tables and graphs in your report as appropriate. Use Minitab and produce the appropriate output to answer the following questions. Attach or include the Minitab...
A new version of the operating system is being planned for installation into your department’s production...
A new version of the operating system is being planned for installation into your department’s production environment. What sort of testing would you recommend is done before your department goes live with the new version? Identify each type of testing and describe what is tested. Explain the rationale for performing each type of testing. [ your answer goes here ] Would the amount of testing and types of testing to be done be different if you were installing a security...
The following ANOVA model is for a multiple regression model with two independent variables: Degrees of Sum of Mean Source Freedom Squares ...
 The following ANOVA model is for a multiple regression model
with two independent variables:
Degrees
of
Sum
of
Mean
Source
Freedom
Squares
Squares
F
Regression
2
60
Error
18
120
Total
20
180
Determine the Regression Mean Square (MSR):
Determine the Mean Square Error (MSE):
Compute the overall Fstat test statistic.
Is the Fstat significant at the 0.05 level?
A linear regression was run on auto sales relative to consumer
income. The Regression Sum of Squares (SSR) was 360 and...
The following ANOVA model is for a multiple regression model
with two independent variables:
Degrees
of
Sum
of
Mean
Source
Freedom
Squares
Squares
F
Regression
2
60
Error
18
120
Total
20
180
Determine the Regression Mean Square (MSR):
Determine the Mean Square Error (MSE):
Compute the overall Fstat test statistic.
Is the Fstat significant at the 0.05 level?
A linear regression was run on auto sales relative to consumer
income. The Regression Sum of Squares (SSR) was 360 and...
8. If a line is balanced with 80 percent efficiency, the "balance delay" will be: 20 percent. B. 80 pe...
 8. If a line is balanced with 80 percent efficiency, the "balance delay" will be: 20 percent. B. 80 percent. C. 100 percent. D. unknown, since balance delay is not related to efficieney. E. depends on the next operation. 9. A common goal in designing process layouts is: A. minimizing the number of workers. B. minimizing number of machines. minimizing transportation costs. maximizing workstation productive time E. maximizing transportation distances. 07) vnit 10. The maximum allowable cycle time is computed...
(I did this homework in completion but professor was not happy with answers whatsoever, need additional...
 (I did this homework in completion but professor was
not happy with answers whatsoever, need additional answers and
especially improvement to 1.b
help!! photos not attaching?
mean by severai steps. inis is a View Feedback homework and will need you to work, in one two View Feedback or various steps. Unfortunately, I cannot read your screen shot of what you did on excel. As I have said in numerous messages announcements etc, I cannot аcсept pictures. You need to write...
(I did this homework in completion but professor was
not happy with answers whatsoever, need additional answers and
especially improvement to 1.b
help!! photos not attaching?
mean by severai steps. inis is a View Feedback homework and will need you to work, in one two View Feedback or various steps. Unfortunately, I cannot read your screen shot of what you did on excel. As I have said in numerous messages announcements etc, I cannot аcсept pictures. You need to write...
1. Many companies use a incoming shipments of parts, raw materials, and so on. In the...
 1. Many companies use a incoming shipments of parts, raw materials, and so on. In the electronics industry, component parts are commonly shipped from suppliers in large lots. Inspection of a sample of n components can be viewed as the n trials of a binomial experimem. The outcome for each component tested (trialD will be that the component is classified as good or defective defective components in the lot do not exceed 1 %. Suppose a random sample of fiver...
Please Use your keyboard (Don't use handwriting) *******Please re-write my answer I need new and unique...
Please Use your keyboard (Don't use handwriting) *******Please re-write my answer I need new and unique answers, please. (Use your own words, don't copy and paste)***** Case Study 1: Should a Computer Grade Your Essays? Would you like your college essays graded by a computer? Well, you just might find that happening in your next course. In April 2013, EdX, a Harvard/MIT joint venture to develop massively open online courses (MOOCs), launched an essay-scoring program. Using artificial intelligence technology, essays...
 Q3. A company in the field of fast moving consumer goods has launched several new products in recent years. The sales manager has to provide a forecast for sales in the next quarter. These forecasts are used to draw up an initial production plan, which is updated daily as new data becomes available. To provide these forecasts, the sales manager has conducted regression analysis but needs your advice on its interpretation. Extracts from the Excel regression analysis for products A...
 The following ANOVA model is for a multiple regression model
with two independent variables:
Degrees
of
Sum
of
Mean
Source
Freedom
Squares
Squares
F
Regression
2
60
Error
18
120
Total
20
180
Determine the Regression Mean Square (MSR):
Determine the Mean Square Error (MSE):
Compute the overall Fstat test statistic.
Is the Fstat significant at the 0.05 level?
A linear regression was run on auto sales relative to consumer
income. The Regression Sum of Squares (SSR) was 360 and...
The following ANOVA model is for a multiple regression model
with two independent variables:
Degrees
of
Sum
of
Mean
Source
Freedom
Squares
Squares
F
Regression
2
60
Error
18
120
Total
20
180
Determine the Regression Mean Square (MSR):
Determine the Mean Square Error (MSE):
Compute the overall Fstat test statistic.
Is the Fstat significant at the 0.05 level?
A linear regression was run on auto sales relative to consumer
income. The Regression Sum of Squares (SSR) was 360 and...
 8. If a line is balanced with 80 percent efficiency, the "balance delay" will be: 20 percent. B. 80 percent. C. 100 percent. D. unknown, since balance delay is not related to efficieney. E. depends on the next operation. 9. A common goal in designing process layouts is: A. minimizing the number of workers. B. minimizing number of machines. minimizing transportation costs. maximizing workstation productive time E. maximizing transportation distances. 07) vnit 10. The maximum allowable cycle time is computed...
 (I did this homework in completion but professor was
not happy with answers whatsoever, need additional answers and
especially improvement to 1.b
help!! photos not attaching?
mean by severai steps. inis is a View Feedback homework and will need you to work, in one two View Feedback or various steps. Unfortunately, I cannot read your screen shot of what you did on excel. As I have said in numerous messages announcements etc, I cannot аcсept pictures. You need to write...
(I did this homework in completion but professor was
not happy with answers whatsoever, need additional answers and
especially improvement to 1.b
help!! photos not attaching?
mean by severai steps. inis is a View Feedback homework and will need you to work, in one two View Feedback or various steps. Unfortunately, I cannot read your screen shot of what you did on excel. As I have said in numerous messages announcements etc, I cannot аcсept pictures. You need to write...
 1. Many companies use a incoming shipments of parts, raw materials, and so on. In the electronics industry, component parts are commonly shipped from suppliers in large lots. Inspection of a sample of n components can be viewed as the n trials of a binomial experimem. The outcome for each component tested (trialD will be that the component is classified as good or defective defective components in the lot do not exceed 1 %. Suppose a random sample of fiver...
Most questions answered within 3 hours.
-
Where is the error in this code sequence?
String s1 = "Hello";
String s2 = "ello";...
asked 11 months ago -
Financial data for Joel de Paris, Inc., for last year
follow:
Joel de Paris, Inc.
Balance...
asked 11 months ago -
Consider this reaction:
Al2(SO4)3 (aq)+ BaCl3
(aq) Al2Cl6 (aq)- +
3BaSO4(s) . What is the...
asked 11 months ago -
Suppose that Savneet is considering increasing her
recent random sample from 20 car rentals to 40...
asked 11 months ago -
Trucks arrive at an unloading terminal at an average rate of 120
per hour.
Trucks arrive...
asked 11 months ago -
Why are methanol and ethanol completely soluble in water while
octanol is not very little soluble....
asked 11 months ago -
A facilities manager at a university reads in a research report
that the mean amount of...
asked 11 months ago -
When the CuSO4 is rehydrated by adding water to the anhydrous
compound, is this an endothermic...
asked 11 months ago -
A ray of sunlight is passing from diamond into crown glass; the
angle of incidence is...
asked 11 months ago -
A block of mass 0.249 kg is placed on top of a light, vertical
spring of...
asked 11 months ago -
how do the kidneys compensate in the presences of acidosis
a) trigger hyperventilate
b) reserve acid...
asked 11 months ago -
Question 501 pts
The rental rate of capital to the firm increases. Which of the
following...
asked 11 months ago