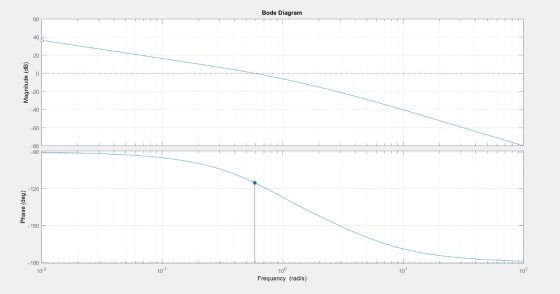
![2. [4pt] Sketch the Bode plots for the system below G(s) = S+ 2 s(s + 1)(s + 3) a. [2pt] Magnitude Response b. [2pt] Phase Re](http://img.homeworklib.com/questions/dc946d00-a74d-11eb-8194-df4270705fd6.png?x-oss-process=image/resize,w_560)
Homework Answers
![MATLABR2019bbin Command Window >> sys=tf([1 2],[1 4 3 0]) sys = S - - - - + 2 -------- s^2 + 3 S S^3 + 4 Continuous-time tran](http://img.homeworklib.com/questions/6cca26a0-a77a-11eb-b176-2978aaa46e26.png?x-oss-process=image/resize,w_560)
Add Answer to:
2. [4pt] Sketch the Bode plots for the system below G(s) = S+ 2 s(s +...
3 Bode sketch 40 pts Sketch the Bode asymptotic magnitude and asymptotic phase plots for G(s)
 3 Bode sketch 40 pts Sketch the Bode asymptotic magnitude and asymptotic phase plots for G(s)
For the given system (s+25) P(s) s(s+1)(s+3000) 1. Sketch, by hand, the Bode asymptote plots for phase and magnitude. S...
 For the given system (s+25) P(s) s(s+1)(s+3000) 1. Sketch, by hand, the Bode asymptote plots for phase and magnitude. Show all your work 2. Sketch by hand the Nyquist plot of the system 3. What is the system's upward, downward gain margins?
For the given system (s+25) P(s) s(s+1)(s+3000) 1. Sketch, by hand, the Bode asymptote plots for phase and magnitude. Show all your work 2. Sketch by hand the Nyquist plot of the system 3. What is the system's...
For the given system (s+25) P(s) s(s+1)(s+3000) 1. Sketch, by hand, the Bode asymptote plots for phase and magnitude. Show all your work 2. Sketch by hand the Nyquist plot of the system 3. What is the system's upward, downward gain margins?
For the given system (s+25) P(s) s(s+1)(s+3000) 1. Sketch, by hand, the Bode asymptote plots for phase and magnitude. Show all your work 2. Sketch by hand the Nyquist plot of the system 3. What is the system's...
Sketch the Bode magnitude and phase plots for the following transfer function: G(s)=- a fimction: G(9)=...
 Sketch the Bode magnitude and phase plots for the following transfer function: G(s)=- a fimction: G(9)= (s+2016+4) (s + 2)(+4)
1- For each transfer function below, sketch the Bode magnitude and phase plots, a) T(s) 3040S...
 1- For each transfer function below, sketch the Bode magnitude and phase plots, a) T(s) 3040S b) T(S) 30-405
Bode Plots Sketch the Bode plot magnitude and phase for each of the three open-loop transfer...
Bode Plots Sketch the Bode plot magnitude and phase for each of the three open-loop transfer functions listed below. Verify your results using the bode m function in MATLAB.(a) \(G(s)=\frac{100}{s(0.1 s+1)(0.01 s+1)}\)(b) \(G(s)=\frac{1}{(s+1)^{2}\left(s^{2}+s+9\right)}\)(c) \(G(s)=\frac{16000 s}{(s+1)(s+100)\left(s^{2}+5 s+1600\right)}\)
Please solve the question below: Required are the Bode Magnitude Plots for G(s), C(s) and G(s)C(s...
 Please solve the question below:
Required are the Bode Magnitude Plots for G(s), C(s) and
G(s)C(s) AND the discretized controller in Z-transform (using
Generalized Bilinear Transformation) AND Derive the Euler and
Tustin discretization
2.Given a continuous control system in the following figure, the plant ()-+2) plant G(s)- and +2) the controller Ca-il.7(s +4.41) 8 + 18.4 41.7(s4.41) 18.4 4 s( 2) a). Sketch the Bode magnitude plots of the plant G(s), the controller C(s), and the controlled plant G(s)C( b)....
Please solve the question below:
Required are the Bode Magnitude Plots for G(s), C(s) and
G(s)C(s) AND the discretized controller in Z-transform (using
Generalized Bilinear Transformation) AND Derive the Euler and
Tustin discretization
2.Given a continuous control system in the following figure, the plant ()-+2) plant G(s)- and +2) the controller Ca-il.7(s +4.41) 8 + 18.4 41.7(s4.41) 18.4 4 s( 2) a). Sketch the Bode magnitude plots of the plant G(s), the controller C(s), and the controlled plant G(s)C( b)....
Sketch the approximate Bode magnitude and phase plots for the following transfer functions by hand. a....
 Sketch the approximate Bode magnitude and phase plots for the following transfer functions by hand. a. G(s) b. G(s)- 200 (s2 +2s)(0.1s +1) s+1 s2 +2s +100
For the following closed-loop transfer functions, sketch the bode plots (magnitude and phase), id...
 For the following closed-loop transfer functions, sketch the bode plots (magnitude and phase), iden- tifying the zero gain, the slopes (in Decibels) and the high-frequency cutt-off rate. Then verify with Matlab (6) wn = 1, 〈 0.0.1, and 0.707. (8) Assuming the system of Problem 6 above, and an input of r(t) = 30sin(1000 t), use your bode plot to obtain the steady-state response
For the following closed-loop transfer functions, sketch the bode plots (magnitude and phase), iden- tifying the...
For the following closed-loop transfer functions, sketch the bode plots (magnitude and phase), iden- tifying the zero gain, the slopes (in Decibels) and the high-frequency cutt-off rate. Then verify with Matlab (6) wn = 1, 〈 0.0.1, and 0.707. (8) Assuming the system of Problem 6 above, and an input of r(t) = 30sin(1000 t), use your bode plot to obtain the steady-state response
For the following closed-loop transfer functions, sketch the bode plots (magnitude and phase), iden- tifying the...
Problem 5: For the following transfer functions, sketch the bode asymptotic magnitude and phase p...
 Problem 5: For the following transfer functions, sketch the bode asymptotic magnitude and phase plots, find the Gain margin and Phase margin, find the system type and the corresponding error constant for each case. G(A) (s +3)(s +5) s(s +2) (s+4) S+5 2)b).
Problem 5: For the following transfer functions, sketch the bode asymptotic magnitude and phase plots, find the Gain margin and Phase margin, find the system type and the corresponding error constant for each case. G(A) (s +3)(s...
Problem 5: For the following transfer functions, sketch the bode asymptotic magnitude and phase plots, find the Gain margin and Phase margin, find the system type and the corresponding error constant for each case. G(A) (s +3)(s +5) s(s +2) (s+4) S+5 2)b).
Problem 5: For the following transfer functions, sketch the bode asymptotic magnitude and phase plots, find the Gain margin and Phase margin, find the system type and the corresponding error constant for each case. G(A) (s +3)(s...
find Consider the Transfer Function Shown Below: G(S) = (s +2) s(s + 3)(s + 5)2...
 find
Consider the Transfer Function Shown Below: G(S) = (s +2) s(s + 3)(s + 5)2 a. Plot the magnitude and phase plots for each element of the above transfer function. (1 b. Plot the Bode magnitude and phase plots of the system in the given logarithmic paper. Use the plotted Bode plots to estimate the gain and phase margins of the system. (10 P d. Is the system stable or not? Explain why? (5 Pts) C.
find
Consider the Transfer Function Shown Below: G(S) = (s +2) s(s + 3)(s + 5)2 a. Plot the magnitude and phase plots for each element of the above transfer function. (1 b. Plot the Bode magnitude and phase plots of the system in the given logarithmic paper. Use the plotted Bode plots to estimate the gain and phase margins of the system. (10 P d. Is the system stable or not? Explain why? (5 Pts) C.
 3 Bode sketch 40 pts Sketch the Bode asymptotic magnitude and asymptotic phase plots for G(s)
 For the given system (s+25) P(s) s(s+1)(s+3000) 1. Sketch, by hand, the Bode asymptote plots for phase and magnitude. Show all your work 2. Sketch by hand the Nyquist plot of the system 3. What is the system's upward, downward gain margins?
For the given system (s+25) P(s) s(s+1)(s+3000) 1. Sketch, by hand, the Bode asymptote plots for phase and magnitude. Show all your work 2. Sketch by hand the Nyquist plot of the system 3. What is the system's...
For the given system (s+25) P(s) s(s+1)(s+3000) 1. Sketch, by hand, the Bode asymptote plots for phase and magnitude. Show all your work 2. Sketch by hand the Nyquist plot of the system 3. What is the system's upward, downward gain margins?
For the given system (s+25) P(s) s(s+1)(s+3000) 1. Sketch, by hand, the Bode asymptote plots for phase and magnitude. Show all your work 2. Sketch by hand the Nyquist plot of the system 3. What is the system's...
 Sketch the Bode magnitude and phase plots for the following transfer function: G(s)=- a fimction: G(9)= (s+2016+4) (s + 2)(+4)
 1- For each transfer function below, sketch the Bode magnitude and phase plots, a) T(s) 3040S b) T(S) 30-405
 Please solve the question below:
Required are the Bode Magnitude Plots for G(s), C(s) and
G(s)C(s) AND the discretized controller in Z-transform (using
Generalized Bilinear Transformation) AND Derive the Euler and
Tustin discretization
2.Given a continuous control system in the following figure, the plant ()-+2) plant G(s)- and +2) the controller Ca-il.7(s +4.41) 8 + 18.4 41.7(s4.41) 18.4 4 s( 2) a). Sketch the Bode magnitude plots of the plant G(s), the controller C(s), and the controlled plant G(s)C( b)....
Please solve the question below:
Required are the Bode Magnitude Plots for G(s), C(s) and
G(s)C(s) AND the discretized controller in Z-transform (using
Generalized Bilinear Transformation) AND Derive the Euler and
Tustin discretization
2.Given a continuous control system in the following figure, the plant ()-+2) plant G(s)- and +2) the controller Ca-il.7(s +4.41) 8 + 18.4 41.7(s4.41) 18.4 4 s( 2) a). Sketch the Bode magnitude plots of the plant G(s), the controller C(s), and the controlled plant G(s)C( b)....
 Sketch the approximate Bode magnitude and phase plots for the following transfer functions by hand. a. G(s) b. G(s)- 200 (s2 +2s)(0.1s +1) s+1 s2 +2s +100
 For the following closed-loop transfer functions, sketch the bode plots (magnitude and phase), iden- tifying the zero gain, the slopes (in Decibels) and the high-frequency cutt-off rate. Then verify with Matlab (6) wn = 1, 〈 0.0.1, and 0.707. (8) Assuming the system of Problem 6 above, and an input of r(t) = 30sin(1000 t), use your bode plot to obtain the steady-state response
For the following closed-loop transfer functions, sketch the bode plots (magnitude and phase), iden- tifying the...
For the following closed-loop transfer functions, sketch the bode plots (magnitude and phase), iden- tifying the zero gain, the slopes (in Decibels) and the high-frequency cutt-off rate. Then verify with Matlab (6) wn = 1, 〈 0.0.1, and 0.707. (8) Assuming the system of Problem 6 above, and an input of r(t) = 30sin(1000 t), use your bode plot to obtain the steady-state response
For the following closed-loop transfer functions, sketch the bode plots (magnitude and phase), iden- tifying the...
 Problem 5: For the following transfer functions, sketch the bode asymptotic magnitude and phase plots, find the Gain margin and Phase margin, find the system type and the corresponding error constant for each case. G(A) (s +3)(s +5) s(s +2) (s+4) S+5 2)b).
Problem 5: For the following transfer functions, sketch the bode asymptotic magnitude and phase plots, find the Gain margin and Phase margin, find the system type and the corresponding error constant for each case. G(A) (s +3)(s...
Problem 5: For the following transfer functions, sketch the bode asymptotic magnitude and phase plots, find the Gain margin and Phase margin, find the system type and the corresponding error constant for each case. G(A) (s +3)(s +5) s(s +2) (s+4) S+5 2)b).
Problem 5: For the following transfer functions, sketch the bode asymptotic magnitude and phase plots, find the Gain margin and Phase margin, find the system type and the corresponding error constant for each case. G(A) (s +3)(s...
 find
Consider the Transfer Function Shown Below: G(S) = (s +2) s(s + 3)(s + 5)2 a. Plot the magnitude and phase plots for each element of the above transfer function. (1 b. Plot the Bode magnitude and phase plots of the system in the given logarithmic paper. Use the plotted Bode plots to estimate the gain and phase margins of the system. (10 P d. Is the system stable or not? Explain why? (5 Pts) C.
find
Consider the Transfer Function Shown Below: G(S) = (s +2) s(s + 3)(s + 5)2 a. Plot the magnitude and phase plots for each element of the above transfer function. (1 b. Plot the Bode magnitude and phase plots of the system in the given logarithmic paper. Use the plotted Bode plots to estimate the gain and phase margins of the system. (10 P d. Is the system stable or not? Explain why? (5 Pts) C.
Most questions answered within 3 hours.
-
Where is the error in this code sequence?
String s1 = "Hello";
String s2 = "ello";...
asked 10 months ago -
Financial data for Joel de Paris, Inc., for last year
follow:
Joel de Paris, Inc.
Balance...
asked 10 months ago -
Consider this reaction:
Al2(SO4)3 (aq)+ BaCl3
(aq) Al2Cl6 (aq)- +
3BaSO4(s) . What is the...
asked 10 months ago -
Suppose that Savneet is considering increasing her
recent random sample from 20 car rentals to 40...
asked 10 months ago -
Trucks arrive at an unloading terminal at an average rate of 120
per hour.
Trucks arrive...
asked 10 months ago -
Why are methanol and ethanol completely soluble in water while
octanol is not very little soluble....
asked 10 months ago -
A facilities manager at a university reads in a research report
that the mean amount of...
asked 10 months ago -
When the CuSO4 is rehydrated by adding water to the anhydrous
compound, is this an endothermic...
asked 10 months ago -
A ray of sunlight is passing from diamond into crown glass; the
angle of incidence is...
asked 10 months ago -
A block of mass 0.249 kg is placed on top of a light, vertical
spring of...
asked 10 months ago -
how do the kidneys compensate in the presences of acidosis
a) trigger hyperventilate
b) reserve acid...
asked 10 months ago -
Question 501 pts
The rental rate of capital to the firm increases. Which of the
following...
asked 10 months ago