

Homework Answers
Part a)
Claim : Tires of company A outlast the tires of company B by more than 10000 miles
H0: µA - µB = 10000
Ha : µA - µB > 10000
We can find the sample means and sample sd of the given data set using excel functions =AVERAGE(data set column range )
and =STDEV.S( data set column range ) respectively.
So sample mean for company A =  1 = 56064.66
sample SD for company A = S1 =2748.69
sample size for company A = n1 = 40
sample mean for company B =
2 = 45724.64
sample SD for company B = S2 = 3176.60
sample size for company B = n2 = 32
We can use the Ti-84 calculator to find the Test statistic and p value :
Press STAT ---> Scroll to TESTS --> Select 2-sample T test and hit enter
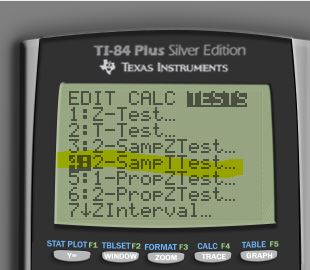
Then select Stats and hit enter. then plug the values accordingly
While entering the value for
1 subtract 10000 , since
we have difference µA
- µB = 10000
So plug
1 = 46064.66

Select the sign at Ha , for pooled : select Yes and hit enter
Then scroll to calculate and hit enter


So Test statistic = 0.49
P-value = 0.3140
Conclusion : As p-value is greater than α =( 0.05) , we fail to reject H0
Part b) we are asked to find 98% confidence interval for µA - µB
We can use function 2- sample T Interval in TI-84 calculator .
Press STAT ---> Scroll to TESTS --> scroll down to 2-sample T Interval and hit enter.
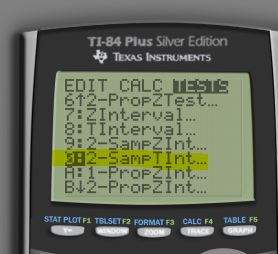
Then select Stats and hit enter. then plug the values accordingly
For confidence interval plug the calculated value
of 1
= 56064.66

Plug C- Level = 0.98 and for pooled : select Yes and hit enter
Then scroll to calculate and hit enter


Therefore 98% confidence interval for µA - µB is ( 8676.6 , 12003 )
Add Answer to:
Prob1 Company A 52098.70805 50981.26776 59275.73435 53082.52597 53886.08272 51668.41772 53138.68242 54356.09171 59544.14955 53937.52316 56636.40834 54516.06871 56651.47495...
3. Suppose that we are testing Ho: u = 80 vs. Ha: u <80 at the...
 3. Suppose that we are testing Ho: u = 80 vs. Ha: u <80 at the .05 level and we are going to collect 10 pieces of data and o=1.2. Determine the probability of Type Il error for the alternative kl. = 79.25. ANSWER 4. Company A claims that their tires outlast the tires of Company B by more than 12.000 miles. We feel certain that Il = 62,000 ,- 5,100. Data for Company A is collected and summarized: Company...
4B. Company C claims that their process is more consistent than Company D. Data from the...
 4B. Company C claims that their process is more consistent than Company D. Data from the two companies is collected and stored in the Assignment 3A Minitab Worksheet. Test the claim at the .05 level, not assuming normal. Ho: Test Statistic: Ha: p-value to 5 decimal places: Conclusion: Fail to Reject Ho Reject Ho Conclusion in words: Company C Company D 124.937 124.929 125.013 124.830 124.976 124.763 125.121 124.989 125.010 125.097 125.098 124.984 124.913 125.084 125.009 125.152 125.085 124.987 125.037...
1. An automobile tire manufacturer would like to claim that the tread life (in miles) of...
 1. An automobile tire manufacturer would like to claim that the tread life (in miles) of a certain type of tire is greater than 30,000 miles. Assuming a normal population with 1500 miles answer the following for a test of the hypotheses Ho :-30,000 versus Ha : μ > 30,000 a) Ifa -.01 specify the rejection region as an inequality involving the value of the test statistic b) Based on a sample size of n 25, the corresponding rejection region...
A TV ad claims that a certain brand of tire has an average lifetime of more...
 A TV ad claims that a certain brand of tire has an average lifetime of more than 60,000 miles. Suppose you plan to test this claim by taking a sample of tires and put them to test. The correct set of hypotheses to set up is: Ho: μ 60,000 and Ha: μ>60,000 Ho: μ 60.000 and HA:μ> 60,000 Ho: μ-60,000 and HA: μ 60,000 Ho: μ+60,000 and HA: μ > 60,000 n. A. B. C. D.
n. A TV ad claims that a certain brand of tire has an average lifetime of...
 n. A TV ad claims that a certain brand of tire has an average lifetime of more than 60,000 miles. Suppose you plan to test this claim by taking a sample of tires and put them to test. The correct set of hypotheses to set up is: A. Ho: H560,00 B. Ho:»-60,000 C. D, Ho: μ-60000 and and and and H: 60,000 HA:p>60,00 HA: μ-60,000 HA: μ>60,000 Ho: μ-60,000 Show transcribed image text Expert Answer o
(1 point) (Give answers to at least two decimal places. For simplicity, use the standard normal...
 (1 point) (Give answers to at least two decimal places. For simplicity, use the standard normal distribution bacause the samples are both large.) In order to compare the means of two populations, independent random samples of 93 observations are selected from each population, with the following results: Sample 1 Sample 2 s1 = 170 s2 = 195 (a) Use a 98 % confidence interval to estimate the difference between the population means ( ) - Test the null hypothesis: Ho...
Independent random samples selected from two normal populations produced the sample means and standard deviations shown...
 Independent random samples selected from two normal populations produced the sample means and standard deviations shown to the right. a. Assuming equal variances, conduct the test Ho (H1-H2) = 0 against Hy: (H1-H2) #0 using a = 0.10. b. Find and interpret the 90% confidence interval for (H1-H2) Sample 1 Sample 2 ny - 18 ng - 11 X2 7.8 X = 5.6 Sy = 3.1 82 4.7 a. Find the test statistic, The test statistic is (Round to two...
Use a t-test to test the claim about the population mean μ at the given level...
 Use a t-test to test the claim about the population mean μ at the given level of significance α using the given sample statistics. Assume the population is normally distributed. Claim: μ z 8300; α= 0.10 Sample statistics: x= 8100, s= 470, n= 22 18. What are the null and alternative hypotheses? ○ A. H0:1128300 O c. Ho: μ#8300 O B. Ho: μ#8300 Ha: μ = 8300 D. Ho: μ 8300 Ha: μ > 8300 Ha: μ < 8300 Ha:...
5. A data set includes data from 400 random tornadoes. The display from technology available below...
 5. A data set includes data from 400 random tornadoes. The display from technology available below results from using the tomado lengths (miles) to test the claim that the mean tornado length is greater than 2.2 miles. Use a 0.05 significance level. Identify the null and alternative hypotheses, test statistic, P-value, and state the final conclusion that addresses the original claim. Click the icon to view the display from technology. What are the null and alterative hypotheses? O A. Hoh=2.2...
Use a test to test the claim o? -0.53 at the a0.01 significance level using sample...
 Use a test to test the claim o? -0.53 at the a0.01 significance level using sample statistics s' =0.483 and Identify the null and alternative hypotheses. 23. Assume the population is normally distributed O A. Ho: 62 -0.53 He: 02 +0.53 OC. He: 220.53 He: 02 <0.53 O B. Ho: 02 +0.53 H,:o? =0.53 OD. Ho: 0250.53 Hy: OP >0.53 Identify the test statistic. (Round to two decimal places as needed.) Identify the critical value(s). (Round to two decimal places...
 3. Suppose that we are testing Ho: u = 80 vs. Ha: u <80 at the .05 level and we are going to collect 10 pieces of data and o=1.2. Determine the probability of Type Il error for the alternative kl. = 79.25. ANSWER 4. Company A claims that their tires outlast the tires of Company B by more than 12.000 miles. We feel certain that Il = 62,000 ,- 5,100. Data for Company A is collected and summarized: Company...
 4B. Company C claims that their process is more consistent than Company D. Data from the two companies is collected and stored in the Assignment 3A Minitab Worksheet. Test the claim at the .05 level, not assuming normal. Ho: Test Statistic: Ha: p-value to 5 decimal places: Conclusion: Fail to Reject Ho Reject Ho Conclusion in words: Company C Company D 124.937 124.929 125.013 124.830 124.976 124.763 125.121 124.989 125.010 125.097 125.098 124.984 124.913 125.084 125.009 125.152 125.085 124.987 125.037...
 1. An automobile tire manufacturer would like to claim that the tread life (in miles) of a certain type of tire is greater than 30,000 miles. Assuming a normal population with 1500 miles answer the following for a test of the hypotheses Ho :-30,000 versus Ha : μ > 30,000 a) Ifa -.01 specify the rejection region as an inequality involving the value of the test statistic b) Based on a sample size of n 25, the corresponding rejection region...
 A TV ad claims that a certain brand of tire has an average lifetime of more than 60,000 miles. Suppose you plan to test this claim by taking a sample of tires and put them to test. The correct set of hypotheses to set up is: Ho: μ 60,000 and Ha: μ>60,000 Ho: μ 60.000 and HA:μ> 60,000 Ho: μ-60,000 and HA: μ 60,000 Ho: μ+60,000 and HA: μ > 60,000 n. A. B. C. D.
 n. A TV ad claims that a certain brand of tire has an average lifetime of more than 60,000 miles. Suppose you plan to test this claim by taking a sample of tires and put them to test. The correct set of hypotheses to set up is: A. Ho: H560,00 B. Ho:»-60,000 C. D, Ho: μ-60000 and and and and H: 60,000 HA:p>60,00 HA: μ-60,000 HA: μ>60,000 Ho: μ-60,000 Show transcribed image text Expert Answer o
 (1 point) (Give answers to at least two decimal places. For simplicity, use the standard normal distribution bacause the samples are both large.) In order to compare the means of two populations, independent random samples of 93 observations are selected from each population, with the following results: Sample 1 Sample 2 s1 = 170 s2 = 195 (a) Use a 98 % confidence interval to estimate the difference between the population means ( ) - Test the null hypothesis: Ho...
 Independent random samples selected from two normal populations produced the sample means and standard deviations shown to the right. a. Assuming equal variances, conduct the test Ho (H1-H2) = 0 against Hy: (H1-H2) #0 using a = 0.10. b. Find and interpret the 90% confidence interval for (H1-H2) Sample 1 Sample 2 ny - 18 ng - 11 X2 7.8 X = 5.6 Sy = 3.1 82 4.7 a. Find the test statistic, The test statistic is (Round to two...
 Use a t-test to test the claim about the population mean μ at the given level of significance α using the given sample statistics. Assume the population is normally distributed. Claim: μ z 8300; α= 0.10 Sample statistics: x= 8100, s= 470, n= 22 18. What are the null and alternative hypotheses? ○ A. H0:1128300 O c. Ho: μ#8300 O B. Ho: μ#8300 Ha: μ = 8300 D. Ho: μ 8300 Ha: μ > 8300 Ha: μ < 8300 Ha:...
 5. A data set includes data from 400 random tornadoes. The display from technology available below results from using the tomado lengths (miles) to test the claim that the mean tornado length is greater than 2.2 miles. Use a 0.05 significance level. Identify the null and alternative hypotheses, test statistic, P-value, and state the final conclusion that addresses the original claim. Click the icon to view the display from technology. What are the null and alterative hypotheses? O A. Hoh=2.2...
 Use a test to test the claim o? -0.53 at the a0.01 significance level using sample statistics s' =0.483 and Identify the null and alternative hypotheses. 23. Assume the population is normally distributed O A. Ho: 62 -0.53 He: 02 +0.53 OC. He: 220.53 He: 02 <0.53 O B. Ho: 02 +0.53 H,:o? =0.53 OD. Ho: 0250.53 Hy: OP >0.53 Identify the test statistic. (Round to two decimal places as needed.) Identify the critical value(s). (Round to two decimal places...
Most questions answered within 3 hours.
-
Where is the error in this code sequence?
String s1 = "Hello";
String s2 = "ello";...
asked 11 months ago -
Financial data for Joel de Paris, Inc., for last year
follow:
Joel de Paris, Inc.
Balance...
asked 11 months ago -
Consider this reaction:
Al2(SO4)3 (aq)+ BaCl3
(aq) Al2Cl6 (aq)- +
3BaSO4(s) . What is the...
asked 11 months ago -
Suppose that Savneet is considering increasing her
recent random sample from 20 car rentals to 40...
asked 11 months ago -
Trucks arrive at an unloading terminal at an average rate of 120
per hour.
Trucks arrive...
asked 11 months ago -
Why are methanol and ethanol completely soluble in water while
octanol is not very little soluble....
asked 11 months ago -
A facilities manager at a university reads in a research report
that the mean amount of...
asked 11 months ago -
When the CuSO4 is rehydrated by adding water to the anhydrous
compound, is this an endothermic...
asked 11 months ago -
A ray of sunlight is passing from diamond into crown glass; the
angle of incidence is...
asked 11 months ago -
A block of mass 0.249 kg is placed on top of a light, vertical
spring of...
asked 11 months ago -
how do the kidneys compensate in the presences of acidosis
a) trigger hyperventilate
b) reserve acid...
asked 11 months ago -
Question 501 pts
The rental rate of capital to the firm increases. Which of the
following...
asked 11 months ago