
Homework Answers
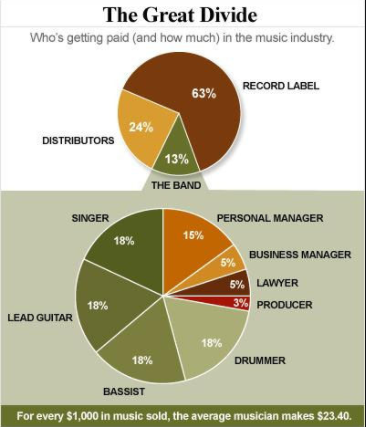
t shall be noted that in the value chain in the music industry, the percentage share of the revenue for the artists, record labels, and distributors are:
Artists (10%), Record Labels (70%) and Distributors (20%)
It shall be noted that in the value chain in the music industry, the percentage share of the revenue for the artists, record labels, and distributors are:
Artists (10%), Record Labels (70%) and Distributors (20%)

Add Answer to:
According to the Spotify case, historically what percent of revenue is kept by each group within...
1. What is the total revenue of this firm if it is producing the level of...
 1. What is the total revenue of this firm if it is producing the
level of output that maximizes profit/minimize loss?
A) $560
B) $420
C) $160
D) $480
2. According to the figure below, what is the total profit of
this monopoly?
A) $240
B) $-120
C) $60
D) $80
Price ($) MC1 AVC1 10 20 30 40 50 60 70 80 90 Quantity Price (s) MC1 TATC1 AVC1 10 20 30 40 50 60 70 80 90 Quantity
1. What is the total revenue of this firm if it is producing the
level of output that maximizes profit/minimize loss?
A) $560
B) $420
C) $160
D) $480
2. According to the figure below, what is the total profit of
this monopoly?
A) $240
B) $-120
C) $60
D) $80
Price ($) MC1 AVC1 10 20 30 40 50 60 70 80 90 Quantity Price (s) MC1 TATC1 AVC1 10 20 30 40 50 60 70 80 90 Quantity
The following data consist of the revenue growth rates (in percent) for a group of 20...
 The following data consist of the revenue growth rates (in percent) for a group of 20 firms 56 42 28 83 49 53 51 43 32 65 63 91 70 42 36 59 30 55 Click here for the Excel Data File Construct a stem-and-leaf display for the above data Stem Unit Leaf Unit Frequenc Stem Leaf 1Growth Rates (in percent) 3 GrowRate 36 30 59 4 6 8 42 65 63 91 70 32 10 12 13 14 15...
Households in China save 40 percent of their annual incomes each year, whereas U.S. households save...
 Households in China save 40 percent of their annual incomes each year, whereas U.S. households save less than 5 percent. At the same time, production possibilities are growing at roughly 9 percent per year in China but only about 3.5 percent in the United States. Use the graphical analysis of "present goods" versus "future goods" to explain the difference between China's growth rate and the U.S. growth rate. Production Possibilities (China) Production Possibilities (United States) 100 100 … 0ppc 80...
31 of 50 (36 complete) This Question: 1 pt Suppose that the distribution of sales within an industry is as shown in the following table: Share of Total Market Sales 15 14 12 Firm 10 10 13 100% All ot...
 31 of 50 (36 complete) This Question: 1 pt Suppose that the distribution of sales within an industry is as shown in the following table: Share of Total Market Sales 15 14 12 Firm 10 10 13 100% All others Total There are 13 "All others" in the industry in the above table, each of which has a share of sales equal to 1 percent. The value of the Herfindahl-Hirschman Index for this industry isEnter your response as a whole...
For each variable of interest – Percent Time Asleep and Longevity – create a grouped frequency...
For each variable of interest – Percent Time Asleep and Longevity – create a grouped frequency histogram. For each histogram, use a class width of 10; use a lower limit of 0 for Percent Time Asleep and 15 for Longevity. Each histogram must include an informative title, along with correct labels for both axes. For each histogram, include a paragraph that answers each of the following questions: Is the histogram symmetric, skewed to the left, or skewed to the right?...
he Art League is a not-for-profit organization dedicated to promoting the arts within the community. There...
 he Art League is a not-for-profit organization dedicated to
promoting the arts within the community. There are two programs
conducted by the Art League: (1) exhibition and sales of members’
art (referred to as Exhibition) and (2) Community Art Education.
Activities of the Art League are conducted by a part-time
administrator, a part-time secretary-bookkeeper, and several
part-time volunteers. The volunteers greet visitors, monitor the
security of the exhibit hall, and handle the sales of art to the
public. Art on...
he Art League is a not-for-profit organization dedicated to
promoting the arts within the community. There are two programs
conducted by the Art League: (1) exhibition and sales of members’
art (referred to as Exhibition) and (2) Community Art Education.
Activities of the Art League are conducted by a part-time
administrator, a part-time secretary-bookkeeper, and several
part-time volunteers. The volunteers greet visitors, monitor the
security of the exhibit hall, and handle the sales of art to the
public. Art on...
those pictures are for the one question, please answer all of them. Thanks! eBook Each year...
 those pictures are for the one question, please answer all of
them. Thanks!
eBook Each year Forbes ranks the world's most valuable brands. A portion of the data for 82 of the brands in the 2013 Forbes list is shown in Table 2.12 (Forbes website, February, 2014), The data set includes the following varlables: The name of the brand The type of Industry assoclated with the brand, labeled Automotive & LuxuryY, Consumer Packaged Goods, Financial Services, Other, Technology A measure...
those pictures are for the one question, please answer all of
them. Thanks!
eBook Each year Forbes ranks the world's most valuable brands. A portion of the data for 82 of the brands in the 2013 Forbes list is shown in Table 2.12 (Forbes website, February, 2014), The data set includes the following varlables: The name of the brand The type of Industry assoclated with the brand, labeled Automotive & LuxuryY, Consumer Packaged Goods, Financial Services, Other, Technology A measure...
spectral problem its all one problem 1) identify the compounds for each group of spectra (mass,...
 spectral problem its all one problem
1) identify the compounds for each group of spectra (mass,
proton, carbon and IR)
2) assign the proton and carbon and IR spectra. identify at
least two possible fragmentation on the mass spectrum
ЗН 1Н 20 200 180 160 140 120 100 во со 40 20 C 69.8; H = 11.6; 20 = 18.6 100 MS-N-0051 10 20 30 40 50 60 70 TTTTTTTTT 80 90
spectral problem its all one problem
1) identify the compounds for each group of spectra (mass,
proton, carbon and IR)
2) assign the proton and carbon and IR spectra. identify at
least two possible fragmentation on the mass spectrum
ЗН 1Н 20 200 180 160 140 120 100 во со 40 20 C 69.8; H = 11.6; 20 = 18.6 100 MS-N-0051 10 20 30 40 50 60 70 TTTTTTTTT 80 90
Bhtpeng.cengage.com/sal Q Search this course CENGAGE MINDTAP Chapter 2 Assignment Each year Forbes ranks the world's...
 Bhtpeng.cengage.com/sal Q Search this course CENGAGE MINDTAP Chapter 2 Assignment Each year Forbes ranks the world's most valuable brands. A portion of the data for 82 of the brands in the 2013 Forbes list is shown in Table 2.12 (Forbes website, February, 2014). The data set includes the following variables: cBooks The name of the brand. Brands 10 The type of industry assocated with the beand, Iabeled Automotive & Luxury, Consumer Packaged Goods Industry Financial Services, Other, Technology. A measure...
spectral problem its all one problem 1) identify the compounds for each group of spectra (mass,...
 spectral problem its all one problem
1) identify the compounds for each group of spectra (mass,
proton, carbon and IR)
2) assign the proton and carbon and IR spectra. identify at
least two possible fragmentation on the mass spectrum
the
values is whats there from the 3rd graph thats all i was
given
#8 1H 5.5 5.0 20 ag 200 180 160 140 120 100 80 0 40 20 C-69.8: H-11.6 -18.6 100 - MS-W-11 80 60 40- 20- 10...
spectral problem its all one problem
1) identify the compounds for each group of spectra (mass,
proton, carbon and IR)
2) assign the proton and carbon and IR spectra. identify at
least two possible fragmentation on the mass spectrum
the
values is whats there from the 3rd graph thats all i was
given
#8 1H 5.5 5.0 20 ag 200 180 160 140 120 100 80 0 40 20 C-69.8: H-11.6 -18.6 100 - MS-W-11 80 60 40- 20- 10...
 1. What is the total revenue of this firm if it is producing the
level of output that maximizes profit/minimize loss?
A) $560
B) $420
C) $160
D) $480
2. According to the figure below, what is the total profit of
this monopoly?
A) $240
B) $-120
C) $60
D) $80
Price ($) MC1 AVC1 10 20 30 40 50 60 70 80 90 Quantity Price (s) MC1 TATC1 AVC1 10 20 30 40 50 60 70 80 90 Quantity
1. What is the total revenue of this firm if it is producing the
level of output that maximizes profit/minimize loss?
A) $560
B) $420
C) $160
D) $480
2. According to the figure below, what is the total profit of
this monopoly?
A) $240
B) $-120
C) $60
D) $80
Price ($) MC1 AVC1 10 20 30 40 50 60 70 80 90 Quantity Price (s) MC1 TATC1 AVC1 10 20 30 40 50 60 70 80 90 Quantity
 The following data consist of the revenue growth rates (in percent) for a group of 20 firms 56 42 28 83 49 53 51 43 32 65 63 91 70 42 36 59 30 55 Click here for the Excel Data File Construct a stem-and-leaf display for the above data Stem Unit Leaf Unit Frequenc Stem Leaf 1Growth Rates (in percent) 3 GrowRate 36 30 59 4 6 8 42 65 63 91 70 32 10 12 13 14 15...
 Households in China save 40 percent of their annual incomes each year, whereas U.S. households save less than 5 percent. At the same time, production possibilities are growing at roughly 9 percent per year in China but only about 3.5 percent in the United States. Use the graphical analysis of "present goods" versus "future goods" to explain the difference between China's growth rate and the U.S. growth rate. Production Possibilities (China) Production Possibilities (United States) 100 100 … 0ppc 80...
 31 of 50 (36 complete) This Question: 1 pt Suppose that the distribution of sales within an industry is as shown in the following table: Share of Total Market Sales 15 14 12 Firm 10 10 13 100% All others Total There are 13 "All others" in the industry in the above table, each of which has a share of sales equal to 1 percent. The value of the Herfindahl-Hirschman Index for this industry isEnter your response as a whole...
 he Art League is a not-for-profit organization dedicated to
promoting the arts within the community. There are two programs
conducted by the Art League: (1) exhibition and sales of members’
art (referred to as Exhibition) and (2) Community Art Education.
Activities of the Art League are conducted by a part-time
administrator, a part-time secretary-bookkeeper, and several
part-time volunteers. The volunteers greet visitors, monitor the
security of the exhibit hall, and handle the sales of art to the
public. Art on...
he Art League is a not-for-profit organization dedicated to
promoting the arts within the community. There are two programs
conducted by the Art League: (1) exhibition and sales of members’
art (referred to as Exhibition) and (2) Community Art Education.
Activities of the Art League are conducted by a part-time
administrator, a part-time secretary-bookkeeper, and several
part-time volunteers. The volunteers greet visitors, monitor the
security of the exhibit hall, and handle the sales of art to the
public. Art on...
 those pictures are for the one question, please answer all of
them. Thanks!
eBook Each year Forbes ranks the world's most valuable brands. A portion of the data for 82 of the brands in the 2013 Forbes list is shown in Table 2.12 (Forbes website, February, 2014), The data set includes the following varlables: The name of the brand The type of Industry assoclated with the brand, labeled Automotive & LuxuryY, Consumer Packaged Goods, Financial Services, Other, Technology A measure...
those pictures are for the one question, please answer all of
them. Thanks!
eBook Each year Forbes ranks the world's most valuable brands. A portion of the data for 82 of the brands in the 2013 Forbes list is shown in Table 2.12 (Forbes website, February, 2014), The data set includes the following varlables: The name of the brand The type of Industry assoclated with the brand, labeled Automotive & LuxuryY, Consumer Packaged Goods, Financial Services, Other, Technology A measure...
 spectral problem its all one problem
1) identify the compounds for each group of spectra (mass,
proton, carbon and IR)
2) assign the proton and carbon and IR spectra. identify at
least two possible fragmentation on the mass spectrum
ЗН 1Н 20 200 180 160 140 120 100 во со 40 20 C 69.8; H = 11.6; 20 = 18.6 100 MS-N-0051 10 20 30 40 50 60 70 TTTTTTTTT 80 90
spectral problem its all one problem
1) identify the compounds for each group of spectra (mass,
proton, carbon and IR)
2) assign the proton and carbon and IR spectra. identify at
least two possible fragmentation on the mass spectrum
ЗН 1Н 20 200 180 160 140 120 100 во со 40 20 C 69.8; H = 11.6; 20 = 18.6 100 MS-N-0051 10 20 30 40 50 60 70 TTTTTTTTT 80 90
 Bhtpeng.cengage.com/sal Q Search this course CENGAGE MINDTAP Chapter 2 Assignment Each year Forbes ranks the world's most valuable brands. A portion of the data for 82 of the brands in the 2013 Forbes list is shown in Table 2.12 (Forbes website, February, 2014). The data set includes the following variables: cBooks The name of the brand. Brands 10 The type of industry assocated with the beand, Iabeled Automotive & Luxury, Consumer Packaged Goods Industry Financial Services, Other, Technology. A measure...
 spectral problem its all one problem
1) identify the compounds for each group of spectra (mass,
proton, carbon and IR)
2) assign the proton and carbon and IR spectra. identify at
least two possible fragmentation on the mass spectrum
the
values is whats there from the 3rd graph thats all i was
given
#8 1H 5.5 5.0 20 ag 200 180 160 140 120 100 80 0 40 20 C-69.8: H-11.6 -18.6 100 - MS-W-11 80 60 40- 20- 10...
spectral problem its all one problem
1) identify the compounds for each group of spectra (mass,
proton, carbon and IR)
2) assign the proton and carbon and IR spectra. identify at
least two possible fragmentation on the mass spectrum
the
values is whats there from the 3rd graph thats all i was
given
#8 1H 5.5 5.0 20 ag 200 180 160 140 120 100 80 0 40 20 C-69.8: H-11.6 -18.6 100 - MS-W-11 80 60 40- 20- 10...
Most questions answered within 3 hours.
-
Where is the error in this code sequence?
String s1 = "Hello";
String s2 = "ello";...
asked 10 months ago -
Financial data for Joel de Paris, Inc., for last year
follow:
Joel de Paris, Inc.
Balance...
asked 10 months ago -
Consider this reaction:
Al2(SO4)3 (aq)+ BaCl3
(aq) Al2Cl6 (aq)- +
3BaSO4(s) . What is the...
asked 10 months ago -
Suppose that Savneet is considering increasing her
recent random sample from 20 car rentals to 40...
asked 10 months ago -
Trucks arrive at an unloading terminal at an average rate of 120
per hour.
Trucks arrive...
asked 10 months ago -
Why are methanol and ethanol completely soluble in water while
octanol is not very little soluble....
asked 10 months ago -
A facilities manager at a university reads in a research report
that the mean amount of...
asked 10 months ago -
When the CuSO4 is rehydrated by adding water to the anhydrous
compound, is this an endothermic...
asked 10 months ago -
A ray of sunlight is passing from diamond into crown glass; the
angle of incidence is...
asked 10 months ago -
A block of mass 0.249 kg is placed on top of a light, vertical
spring of...
asked 10 months ago -
how do the kidneys compensate in the presences of acidosis
a) trigger hyperventilate
b) reserve acid...
asked 10 months ago -
Question 501 pts
The rental rate of capital to the firm increases. Which of the
following...
asked 10 months ago