You must manually create these plots without the use of Matlab!
Homework Answers


Add Answer to:
You must manually create these plots without the use
of Matlab!
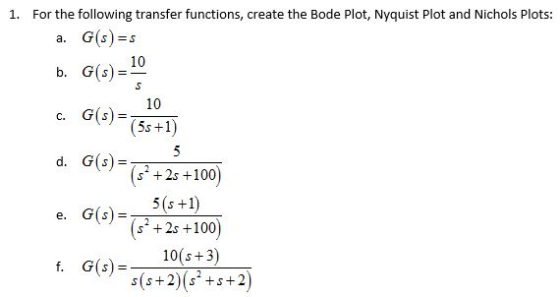
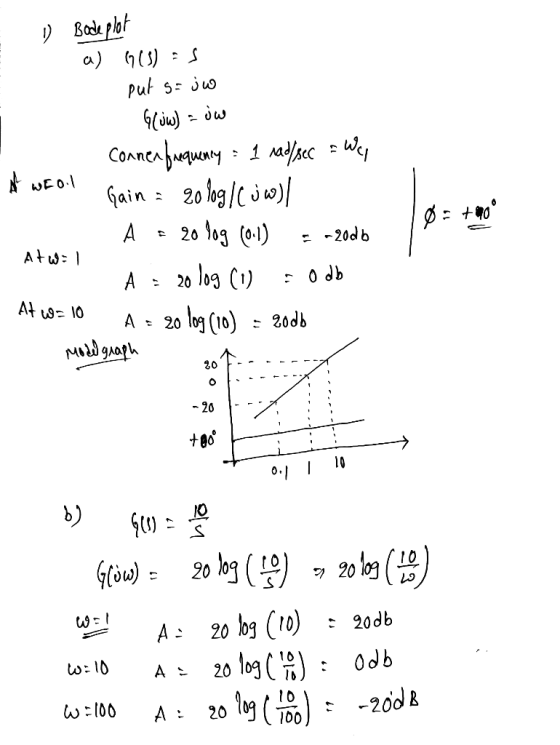
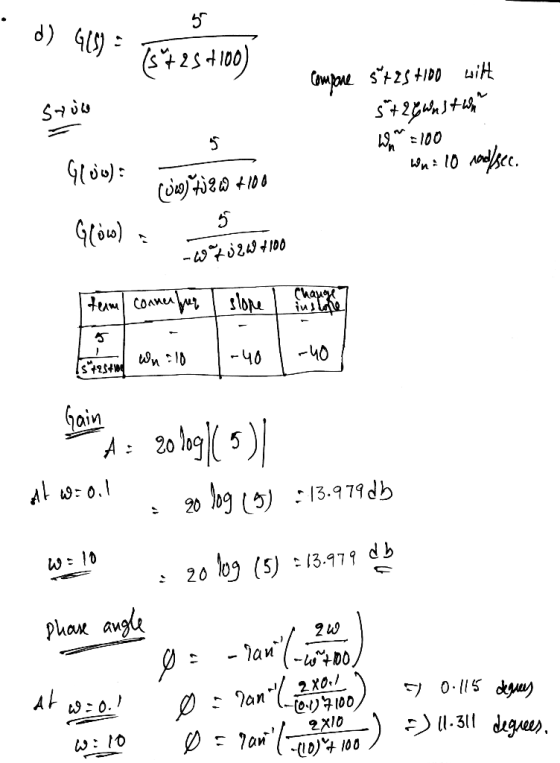
1. For the following transfer...
Use MATLAB to draw Bode Plots for a negative unity feedback system with each of the following for...
 Use MATLAB to draw Bode Plots for a negative unity feedback system with each of the following forward-path transfer functions: 100(s +2) (b) G(s)50s +3 (s+5) Then, using the Bode Plots, s(s +2) (s+4) (s +6) · estimate the transient performance Ts and %OS (step response) . and compare the estimated values with actual values obtained from simulation.
Use MATLAB to draw Bode Plots for a negative unity feedback system with each of the following forward-path transfer functions: 100(s +2)...
Use MATLAB to draw Bode Plots for a negative unity feedback system with each of the following forward-path transfer functions: 100(s +2) (b) G(s)50s +3 (s+5) Then, using the Bode Plots, s(s +2) (s+4) (s +6) · estimate the transient performance Ts and %OS (step response) . and compare the estimated values with actual values obtained from simulation.
Use MATLAB to draw Bode Plots for a negative unity feedback system with each of the following forward-path transfer functions: 100(s +2)...
Question 1: a) Use MATLAB, plot the step repose for the following transfer functions. 48 G(s)-...
 Question 1: a) Use MATLAB, plot the step repose for the following transfer functions. 48 G(s)- (8+6)(s+8) G(s)- 52 +2s + 18 18 Question 2: a) Using MATLAB, plot Bode log-magnitude and phase plot of (s+2)(8+5) G(S) - (s +3) ($2+2s +20) Question 3: Using MATLAB Sketch the root locus of the unity feedback system shown in the figure below: a) Give the values for all critical points of interest. b) Id the system ever unstable? If so, for what...
Following transfer functions are given, manually plot the Nyquist diagram and straight line approximation of Bode...
 Following transfer functions are given, manually plot the Nyquist diagram and straight line approximation of Bode diagram, discuss the system stability G(s)- 3s2 +8s +6 Show all step by step working out to get to final answer as shown below: Nyquist Diagram Nyquist Diagram -2 15 225 Ren Aus Reel Ai: Bode Daaram Dode Dagran 135 4% 10 Freq eney (as 10 Fraquenes (radie ysrom is stable System is stable
Sketch the approximate Bode magnitude and phase plots for the following transfer functions by hand. a....
 Sketch the approximate Bode magnitude and phase plots for the following transfer functions by hand. a. G(s) b. G(s)- 200 (s2 +2s)(0.1s +1) s+1 s2 +2s +100
For the following closed-loop transfer functions, sketch the bode plots (magnitude and phase), id...
 For the following closed-loop transfer functions, sketch the bode plots (magnitude and phase), iden- tifying the zero gain, the slopes (in Decibels) and the high-frequency cutt-off rate. Then verify with Matlab C()101 100) s 0.1) (s 10) 100 s(s +10)2 G(s) = (56) G(s) = s+10(s+100)
For the following closed-loop transfer functions, sketch the bode plots (magnitude and phase), iden- tifying the zero gain, the slopes (in Decibels) and the high-frequency cutt-off rate. Then verify with Matlab C()101 100) s...
For the following closed-loop transfer functions, sketch the bode plots (magnitude and phase), iden- tifying the zero gain, the slopes (in Decibels) and the high-frequency cutt-off rate. Then verify with Matlab C()101 100) s 0.1) (s 10) 100 s(s +10)2 G(s) = (56) G(s) = s+10(s+100)
For the following closed-loop transfer functions, sketch the bode plots (magnitude and phase), iden- tifying the zero gain, the slopes (in Decibels) and the high-frequency cutt-off rate. Then verify with Matlab C()101 100) s...
Bode Plots Sketch the Bode plot magnitude and phase for each of the three open-loop transfer...
Bode Plots Sketch the Bode plot magnitude and phase for each of the three open-loop transfer functions listed below. Verify your results using the bode m function in MATLAB.(a) \(G(s)=\frac{100}{s(0.1 s+1)(0.01 s+1)}\)(b) \(G(s)=\frac{1}{(s+1)^{2}\left(s^{2}+s+9\right)}\)(c) \(G(s)=\frac{16000 s}{(s+1)(s+100)\left(s^{2}+5 s+1600\right)}\)
USE EXCEL i dont get what you mean!!! An industrial plant has the following transfer function:...
 USE EXCEL
i
dont get what you mean!!!
An industrial plant has the following transfer function: K G(S) = s(S+1)(s + 3) The industrial plant forms the forward path of a negative feedback control system with unity feedback (i) Draw the root locus of this control system. (ii) Using a suitable software program, perform the frequency analysis of the control system using the following techniques, assuming K 1: (a) Nyquist (Polar) Plot (b) Nichols Chart (c) Bode Plots (ii) Repeat...
USE EXCEL
i
dont get what you mean!!!
An industrial plant has the following transfer function: K G(S) = s(S+1)(s + 3) The industrial plant forms the forward path of a negative feedback control system with unity feedback (i) Draw the root locus of this control system. (ii) Using a suitable software program, perform the frequency analysis of the control system using the following techniques, assuming K 1: (a) Nyquist (Polar) Plot (b) Nichols Chart (c) Bode Plots (ii) Repeat...
please use matlab etch the Nyquist plot based on the Bode plots for each of the following systems, and then compa...
 please use matlab
etch the Nyquist plot based on the Bode plots for each of the following systems, and then compare your result with that obtained by using the Matlab command nyquist: Don't be concerned with the details of exactly where the curve goes, but do make sure it crosses the real axis at the right spot, has the correct number of -1 encirclements, and goes off to infinity in the correct direction. 6.19 Sk K(0.5 (a) GH(s) K (4s+1)...
please use matlab
etch the Nyquist plot based on the Bode plots for each of the following systems, and then compare your result with that obtained by using the Matlab command nyquist: Don't be concerned with the details of exactly where the curve goes, but do make sure it crosses the real axis at the right spot, has the correct number of -1 encirclements, and goes off to infinity in the correct direction. 6.19 Sk K(0.5 (a) GH(s) K (4s+1)...
Problem-1 (60 pts) Manually sketch (i.e. don't use Matlab) the frequency responses (gain and phase Bode...
 Problem-1 (60 pts) Manually sketch (i.e. don't use Matlab) the frequency responses (gain and phase Bode plots in logarithmic domain) of the following transfer functions (Hint: Clearly identify the poles and zeros, find the contributions from these poles and zeros over the plots, obtain independent gain and phase contributions and combine them in single phase and gain plots). For the plotting, one can use an empty log-log graph, make the hand drawing, scan and add the hand-plotted graph to the...
6. Sketch Bode log magnitude plot for the following transfer functions manually. Then use Matlab's "bode"...
 6. Sketch Bode log magnitude plot for the following transfer functions manually. Then use Matlab's "bode" command to plot the same and compare it with your manually obtained sketches. (s + 10) (s + 200) a) X(s) = TS + 20)-(s +1000) b) X(S) = TS + 1)(52 + 4s + 16)
 Use MATLAB to draw Bode Plots for a negative unity feedback system with each of the following forward-path transfer functions: 100(s +2) (b) G(s)50s +3 (s+5) Then, using the Bode Plots, s(s +2) (s+4) (s +6) · estimate the transient performance Ts and %OS (step response) . and compare the estimated values with actual values obtained from simulation.
Use MATLAB to draw Bode Plots for a negative unity feedback system with each of the following forward-path transfer functions: 100(s +2)...
Use MATLAB to draw Bode Plots for a negative unity feedback system with each of the following forward-path transfer functions: 100(s +2) (b) G(s)50s +3 (s+5) Then, using the Bode Plots, s(s +2) (s+4) (s +6) · estimate the transient performance Ts and %OS (step response) . and compare the estimated values with actual values obtained from simulation.
Use MATLAB to draw Bode Plots for a negative unity feedback system with each of the following forward-path transfer functions: 100(s +2)...
 Question 1: a) Use MATLAB, plot the step repose for the following transfer functions. 48 G(s)- (8+6)(s+8) G(s)- 52 +2s + 18 18 Question 2: a) Using MATLAB, plot Bode log-magnitude and phase plot of (s+2)(8+5) G(S) - (s +3) ($2+2s +20) Question 3: Using MATLAB Sketch the root locus of the unity feedback system shown in the figure below: a) Give the values for all critical points of interest. b) Id the system ever unstable? If so, for what...
 Following transfer functions are given, manually plot the Nyquist diagram and straight line approximation of Bode diagram, discuss the system stability G(s)- 3s2 +8s +6 Show all step by step working out to get to final answer as shown below: Nyquist Diagram Nyquist Diagram -2 15 225 Ren Aus Reel Ai: Bode Daaram Dode Dagran 135 4% 10 Freq eney (as 10 Fraquenes (radie ysrom is stable System is stable
 Sketch the approximate Bode magnitude and phase plots for the following transfer functions by hand. a. G(s) b. G(s)- 200 (s2 +2s)(0.1s +1) s+1 s2 +2s +100
 For the following closed-loop transfer functions, sketch the bode plots (magnitude and phase), iden- tifying the zero gain, the slopes (in Decibels) and the high-frequency cutt-off rate. Then verify with Matlab C()101 100) s 0.1) (s 10) 100 s(s +10)2 G(s) = (56) G(s) = s+10(s+100)
For the following closed-loop transfer functions, sketch the bode plots (magnitude and phase), iden- tifying the zero gain, the slopes (in Decibels) and the high-frequency cutt-off rate. Then verify with Matlab C()101 100) s...
For the following closed-loop transfer functions, sketch the bode plots (magnitude and phase), iden- tifying the zero gain, the slopes (in Decibels) and the high-frequency cutt-off rate. Then verify with Matlab C()101 100) s 0.1) (s 10) 100 s(s +10)2 G(s) = (56) G(s) = s+10(s+100)
For the following closed-loop transfer functions, sketch the bode plots (magnitude and phase), iden- tifying the zero gain, the slopes (in Decibels) and the high-frequency cutt-off rate. Then verify with Matlab C()101 100) s...
 USE EXCEL
i
dont get what you mean!!!
An industrial plant has the following transfer function: K G(S) = s(S+1)(s + 3) The industrial plant forms the forward path of a negative feedback control system with unity feedback (i) Draw the root locus of this control system. (ii) Using a suitable software program, perform the frequency analysis of the control system using the following techniques, assuming K 1: (a) Nyquist (Polar) Plot (b) Nichols Chart (c) Bode Plots (ii) Repeat...
USE EXCEL
i
dont get what you mean!!!
An industrial plant has the following transfer function: K G(S) = s(S+1)(s + 3) The industrial plant forms the forward path of a negative feedback control system with unity feedback (i) Draw the root locus of this control system. (ii) Using a suitable software program, perform the frequency analysis of the control system using the following techniques, assuming K 1: (a) Nyquist (Polar) Plot (b) Nichols Chart (c) Bode Plots (ii) Repeat...
 please use matlab
etch the Nyquist plot based on the Bode plots for each of the following systems, and then compare your result with that obtained by using the Matlab command nyquist: Don't be concerned with the details of exactly where the curve goes, but do make sure it crosses the real axis at the right spot, has the correct number of -1 encirclements, and goes off to infinity in the correct direction. 6.19 Sk K(0.5 (a) GH(s) K (4s+1)...
please use matlab
etch the Nyquist plot based on the Bode plots for each of the following systems, and then compare your result with that obtained by using the Matlab command nyquist: Don't be concerned with the details of exactly where the curve goes, but do make sure it crosses the real axis at the right spot, has the correct number of -1 encirclements, and goes off to infinity in the correct direction. 6.19 Sk K(0.5 (a) GH(s) K (4s+1)...
 Problem-1 (60 pts) Manually sketch (i.e. don't use Matlab) the frequency responses (gain and phase Bode plots in logarithmic domain) of the following transfer functions (Hint: Clearly identify the poles and zeros, find the contributions from these poles and zeros over the plots, obtain independent gain and phase contributions and combine them in single phase and gain plots). For the plotting, one can use an empty log-log graph, make the hand drawing, scan and add the hand-plotted graph to the...
 6. Sketch Bode log magnitude plot for the following transfer functions manually. Then use Matlab's "bode" command to plot the same and compare it with your manually obtained sketches. (s + 10) (s + 200) a) X(s) = TS + 20)-(s +1000) b) X(S) = TS + 1)(52 + 4s + 16)
Most questions answered within 3 hours.
-
Where is the error in this code sequence?
String s1 = "Hello";
String s2 = "ello";...
asked 10 months ago -
Financial data for Joel de Paris, Inc., for last year
follow:
Joel de Paris, Inc.
Balance...
asked 10 months ago -
Consider this reaction:
Al2(SO4)3 (aq)+ BaCl3
(aq) Al2Cl6 (aq)- +
3BaSO4(s) . What is the...
asked 10 months ago -
Suppose that Savneet is considering increasing her
recent random sample from 20 car rentals to 40...
asked 10 months ago -
Trucks arrive at an unloading terminal at an average rate of 120
per hour.
Trucks arrive...
asked 10 months ago -
Why are methanol and ethanol completely soluble in water while
octanol is not very little soluble....
asked 10 months ago -
A facilities manager at a university reads in a research report
that the mean amount of...
asked 10 months ago -
When the CuSO4 is rehydrated by adding water to the anhydrous
compound, is this an endothermic...
asked 10 months ago -
A ray of sunlight is passing from diamond into crown glass; the
angle of incidence is...
asked 10 months ago -
A block of mass 0.249 kg is placed on top of a light, vertical
spring of...
asked 10 months ago -
how do the kidneys compensate in the presences of acidosis
a) trigger hyperventilate
b) reserve acid...
asked 10 months ago -
Question 501 pts
The rental rate of capital to the firm increases. Which of the
following...
asked 10 months ago