
Homework Answers
Add Answer to:
1o 4 A random sample of 9 tourists in Chattanooga showed that they spent an of...
6. The average price of homes sold in the U.S. in 2012 was $240,000. A sample...
6. The average price of homes sold in the U.S. in 2012 was $240,000. A sample of 144 homes sold in Chattanooga in 2012 showed an average price of $246,000. It is known that the standard deviation of the population is $36,000. We are interested in determining whether or not the average price of homes sold in Chattanooga is significantly different than the national average. Let α = .01 a. Verify whether the Central Limit Theorem conditions are met. b....
The null and alternate hypotheses are: H0:µ1≤µ2. H0:µ1>µ2. A random sample of 29 items from the first population show...
The null and alternate hypotheses are: H0:µ1≤µ2. H0:µ1>µ2. A random sample of 29 items from the first population showed a mean of 112 and a standard deviation of 9. A sample of 15 items for the second population showed a mean of 97 and a standard deviation of 12. Use the .01 significance level. a. Find the degrees of freedom for unequal variance test b. State the decision rule for .1 significance level c. Compute the value of the test...
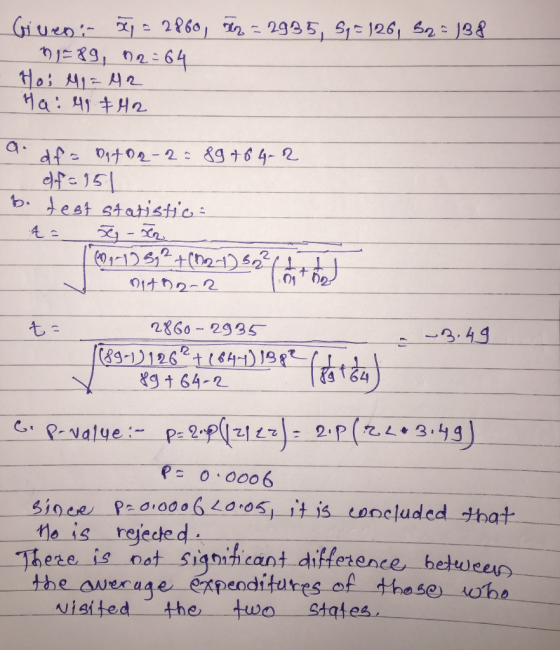
1. A random sample of 82 customers, who visited a department store, spent an average of...
 1. A random sample of 82 customers, who visited a department store, spent an average of $71 at this store. Suppose the standard deviation of expenditures at this store is O = $19. What is the e 98% confidence interval for the population mean? 2. A sample of 25 elements produced a mean of 123.4 and a standard deviation of 18.32 Assuming that the population has a normal distribution, what is the 90% confidence interval for the population mean? 3....
The null and alternate hypotheses are: H0: ?1 ? ?2 H1: ?1 > ?2 A random...
The null and alternate hypotheses are: H0: ?1 ? ?2 H1: ?1 > ?2 A random sample of 24 items from the first population showed a mean of 113 and a standard deviation of 13. A sample of 18 items for the second population showed a mean of 103 and a standard deviation of 14. A) Use the 0.05 significant level. Find the degrees of freedom for unequal variance test. (Round down your answer to the nearest whole number.) B)...
A random sample of 49 measurements from one population had a sample mean of 13, with...
A random sample of 49 measurements from one population had a sample mean of 13, with sample standard deviation 3. An independent random sample of 64 measurements from a second population had a sample mean of 15, with sample standard deviation 4. Test the claim that the population means are different. Use the level of significance 0.01. Using s1 = 3 and s2 = 4, we can compute the t value corresponding to the test statistic x1 − x2 = −2. Recall...
A sample of 36 account balances of a credit company showed an average balance of $1,179...
A sample of 36 account balances of a credit company showed an average balance of $1,179 and a standard deviation of $136. You want to determine if the mean of all account balances is significantly greater than $1,150. Use a 0.05 level of significance. Assume the population of account balances is normally distributed. Compute the test statistic. A sample of 30 account balances of a credit company showed an average balance of $1,165 and a standard deviation of $125. You...
stuck on this Exercise 11-14 (LO11-2) The null and alternate hypotheses are: random sample of 27...
 stuck on this
Exercise 11-14 (LO11-2) The null and alternate hypotheses are: random sample of 27 tems from the first population showed a mean of 110 and a standard deviation of 15. A sample of 19 items for the second population showed a mean of 100 and a standard deviation of 6. Use the 0.025 significant level a. Find the de grees of freedom for unequal variance test. (Round down your answer to the nearest whole number) of freedom 21...
stuck on this
Exercise 11-14 (LO11-2) The null and alternate hypotheses are: random sample of 27 tems from the first population showed a mean of 110 and a standard deviation of 15. A sample of 19 items for the second population showed a mean of 100 and a standard deviation of 6. Use the 0.025 significant level a. Find the de grees of freedom for unequal variance test. (Round down your answer to the nearest whole number) of freedom 21...
Each person in a random sample of 224 male teenagers and a random sample of 303...
Each person in a random sample of 224 male teenagers and a random sample of 303 female teenagers was asked how many hours he or she spent online in a typical week. The sample mean and standard deviation were 15.2 hours and 11.3 hours for males and 14.3 and 11.7 for females. (Use a statistical computer package to calculate the P-value. Use μmales − μfemales. Round your test statistic to two decimal places, your df down to the nearest whole...
Question 10 (0.75 points) A study showed that in a certain month, the mean time spent...
 Question 10 (0.75 points) A study showed that in a certain month, the mean time spent per visit to Facebook was 19.5 minutes. Assume the standard deviation of the population is 8 minutes. Suppose that a simple random sample of 100 visits in that month has a sample mean of 21.13 minutes. A social scientist is interested in knowing whether the mean time of Facebook visits has increased. Perform the hypothesis test and compute the P-value. Write down your P-value....
 1. A random sample of 82 customers, who visited a department store, spent an average of $71 at this store. Suppose the standard deviation of expenditures at this store is O = $19. What is the e 98% confidence interval for the population mean? 2. A sample of 25 elements produced a mean of 123.4 and a standard deviation of 18.32 Assuming that the population has a normal distribution, what is the 90% confidence interval for the population mean? 3....
 stuck on this
Exercise 11-14 (LO11-2) The null and alternate hypotheses are: random sample of 27 tems from the first population showed a mean of 110 and a standard deviation of 15. A sample of 19 items for the second population showed a mean of 100 and a standard deviation of 6. Use the 0.025 significant level a. Find the de grees of freedom for unequal variance test. (Round down your answer to the nearest whole number) of freedom 21...
stuck on this
Exercise 11-14 (LO11-2) The null and alternate hypotheses are: random sample of 27 tems from the first population showed a mean of 110 and a standard deviation of 15. A sample of 19 items for the second population showed a mean of 100 and a standard deviation of 6. Use the 0.025 significant level a. Find the de grees of freedom for unequal variance test. (Round down your answer to the nearest whole number) of freedom 21...
 Question 10 (0.75 points) A study showed that in a certain month, the mean time spent per visit to Facebook was 19.5 minutes. Assume the standard deviation of the population is 8 minutes. Suppose that a simple random sample of 100 visits in that month has a sample mean of 21.13 minutes. A social scientist is interested in knowing whether the mean time of Facebook visits has increased. Perform the hypothesis test and compute the P-value. Write down your P-value....
Most questions answered within 3 hours.
-
Where is the error in this code sequence?
String s1 = "Hello";
String s2 = "ello";...
asked 11 months ago -
Financial data for Joel de Paris, Inc., for last year
follow:
Joel de Paris, Inc.
Balance...
asked 11 months ago -
Consider this reaction:
Al2(SO4)3 (aq)+ BaCl3
(aq) Al2Cl6 (aq)- +
3BaSO4(s) . What is the...
asked 11 months ago -
Suppose that Savneet is considering increasing her
recent random sample from 20 car rentals to 40...
asked 11 months ago -
Trucks arrive at an unloading terminal at an average rate of 120
per hour.
Trucks arrive...
asked 11 months ago -
Why are methanol and ethanol completely soluble in water while
octanol is not very little soluble....
asked 11 months ago -
A facilities manager at a university reads in a research report
that the mean amount of...
asked 11 months ago -
When the CuSO4 is rehydrated by adding water to the anhydrous
compound, is this an endothermic...
asked 11 months ago -
A ray of sunlight is passing from diamond into crown glass; the
angle of incidence is...
asked 11 months ago -
A block of mass 0.249 kg is placed on top of a light, vertical
spring of...
asked 11 months ago -
how do the kidneys compensate in the presences of acidosis
a) trigger hyperventilate
b) reserve acid...
asked 11 months ago -
Question 501 pts
The rental rate of capital to the firm increases. Which of the
following...
asked 11 months ago