
Homework Answers


Add Answer to:
thanks
Consider the simple signal processing system shown in below fig. The sampling periods of the...
thanks Consider the simple signal processing system shown in below fig, the sampling periods of the...
 thanks
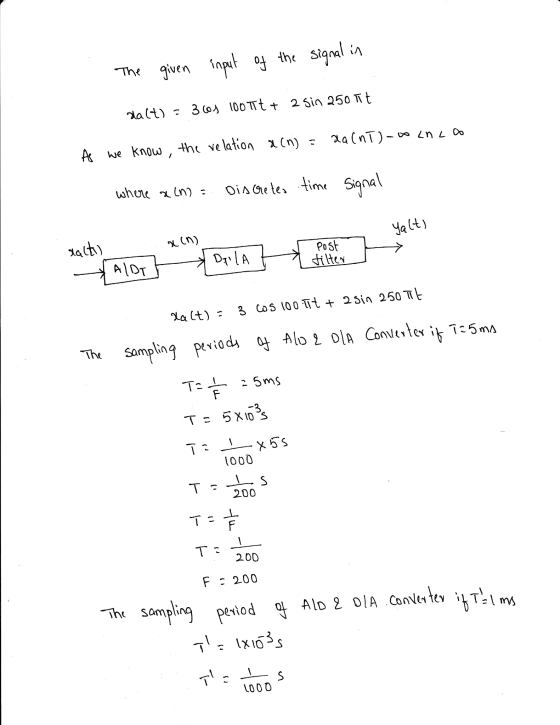
Consider the simple signal processing system shown in below fig, the sampling periods of the A/D and D/A converters T = 5 ms and T' = 1 ms, respectively. Determine the output ya(t) of the system, if the input is x_a(t) = 3 cos 100pi t + 2 sin 250pi t
thanks
Consider the simple signal processing system shown in below fig, the sampling periods of the A/D and D/A converters T = 5 ms and T' = 1 ms, respectively. Determine the output ya(t) of the system, if the input is x_a(t) = 3 cos 100pi t + 2 sin 250pi t
A Digital Signal Processing system is taking at its input the following analogue signal s(t); s(t)...
 A Digital Signal Processing system is taking at its input the following analogue signal s(t); s(t) - 20+ 20 cos(24xt)cos(xt), Where time t is expressed in ms. Part 1 - Setting the sampling frequency: (11 Marks) As a start, the system comprises only a sampler and an ideal analogue reconstructor as follows: w(t) s(t) Sampler Analogue Reconstructor s,(t) Figure a) Find the frequency spectrum S(t) of s(t) and deduce its bandwidth. You may directly use the table provided at the...
onsider the sampling and reconstruction system shown in the figure. x(t) IdealIdeal) D-to-C Converter Converter Assume...
 onsider the sampling and reconstruction system shown in the figure. x(t) IdealIdeal) D-to-C Converter Converter Assume that the sampling rates of the C-to-D and D-to-C converters are equal, and the input to the Ideal C-to-D converter is x(t) = 2 cos (2m(50)t +π) + cos(2π(150e) a. (5) If the output of the Ideal D-to-C converter is equal to the input x(t) i.e. ()2 cos (2m(50)t +7)+cos(2(150)) b. (5) If the sampling rate is fs = 250 samples/sec, determine the discrete-time...
need problem 6.13 done. 12. The analog signal xa (t) = cos (100mt) + cos (120πt) led using natural sampling as shown in Fig. 6.18. The sampling rate used is f, -4 width of each pulse is τ = 0.5 ms...
 need problem 6.13 done.
12. The analog signal xa (t) = cos (100mt) + cos (120πt) led using natural sampling as shown in Fig. 6.18. The sampling rate used is f, -4 width of each pulse is τ = 0.5 ms. Write an analytical expression for the Fourier transform Xa (w) and sketch it. Find an analytical expression for X, () the Fourier transform of the naturally- sampled signal T, (t). a. c. Sketch the transform X, (w). 613. Repeat...
need problem 6.13 done.
12. The analog signal xa (t) = cos (100mt) + cos (120πt) led using natural sampling as shown in Fig. 6.18. The sampling rate used is f, -4 width of each pulse is τ = 0.5 ms. Write an analytical expression for the Fourier transform Xa (w) and sketch it. Find an analytical expression for X, () the Fourier transform of the naturally- sampled signal T, (t). a. c. Sketch the transform X, (w). 613. Repeat...
Problems: 1. Consider the system shown below. Let the input signal to the Ideal Sampler to be: s(...
 just looking for #2, 3, and 4
Problems: 1. Consider the system shown below. Let the input signal to the Ideal Sampler to be: s(t) = 2 cos(2m50t) + 4cos(2m100t) a. (10 points) Determine S(f) and plot it b. (20 points) Let the sampling rate to be: fs 300 samples/sec. Plot the spectrum of the Ideal sample, that is plot S8(f) c. Let the sampling rate to be: fs 175 samples/sec. i. (30 points) Plot S8(f) ii. (10 points) Let...
just looking for #2, 3, and 4
Problems: 1. Consider the system shown below. Let the input signal to the Ideal Sampler to be: s(t) = 2 cos(2m50t) + 4cos(2m100t) a. (10 points) Determine S(f) and plot it b. (20 points) Let the sampling rate to be: fs 300 samples/sec. Plot the spectrum of the Ideal sample, that is plot S8(f) c. Let the sampling rate to be: fs 175 samples/sec. i. (30 points) Plot S8(f) ii. (10 points) Let...
3. (a) Consider the signal xc(t)-sin(2π(40)t). How fast must xe(t) be sanpled to avoid aliasing? ...
 3. (a) Consider the signal xc(t)-sin(2π(40)t). How fast must xe(t) be sanpled to avoid aliasing? Determine the Nyquist rate (the frequency which the sampling rate fs must exceed) for ae(t) (b) Consider processing the signal xe(t) (from part (a)) using the system shown below: Conversion to a sequence Conversion to an impulse train Ideal Reconstruction Filter Hr(ju) p (t) ур y(t) The sampling period for this system is T-1/50 seconds. The DT system H(ei2) is an ideal lowpass filter with...
5. [20 marks Consider the RC series circuit shown in Fig. 3. Determine the overall output...
 5. [20 marks Consider the RC series circuit shown in Fig. 3. Determine the overall output y(t). Determine the steady state output, yss(t), of the circuit if the input signal is given by r(t) = sin (3t) u(t) x(t) = sin(31) C = 0.5 μF Figure 3: RC series circuit for Q5
3: (Practice Problem)Consider the representation of the process of sampling followed by reconstruction shown below oce=nt)...
 3: (Practice Problem)Consider the representation of the process of sampling followed by reconstruction shown below oce=nt) C) Assume that the input signal is Ia(t) = 2 cos(100nt – /4) + cos(300nt + 7/3) -0<t< The frequency response of the reconstruction filter is H.(12) = {T 121</T 10 1921 > A/T (a) Determine the continuous-time Fourier transform X (12) and plot it as a function of N. (b) Assume the fs = 1/T = 500 samples/sec and plot the Fourier transform...
Consider a sampler which samples the continuous-time input signal x(t) at a sampling frequency fs =...
 Consider a sampler which samples the continuous-time input signal x(t) at a sampling frequency fs = 8000 Hz and produces at its output a sampled discrete-time signal x$(t) = x(nTs), where To = 1/fs is the sampling period. If the sampled signal is passed through a unity-gain lowpass filter with cutoff frequency of fs/2, sketch the magnitude spectrum of the resulting signal for the following input signals: (a) x(t) = cos(6000nt). (b) x(t) = cos(12000nt). (c) x(t) = cos(18000nt).
c) An excitation signal x(t) of frequency contents shown below is input to the communication system shown below Find and draw the output signal y(t) or Y(). # if the draw using MATLAB with the code w...
 c) An excitation signal x(t) of
frequency contents shown below is input to the communication system
shown below Find and draw the output signal y(t) or Y().
# if the draw using MATLAB with the code will be better
c) An excitation signal x(t) of frequency contents shown below X(@) 2W 2W is input to the communication system shown below e(t) v(t) 0 -3w 3w cos(5wt) coe(3wt) Find and draw the output signal ) or Y(a).
c) An excitation signal...
c) An excitation signal x(t) of
frequency contents shown below is input to the communication system
shown below Find and draw the output signal y(t) or Y().
# if the draw using MATLAB with the code will be better
c) An excitation signal x(t) of frequency contents shown below X(@) 2W 2W is input to the communication system shown below e(t) v(t) 0 -3w 3w cos(5wt) coe(3wt) Find and draw the output signal ) or Y(a).
c) An excitation signal...
 thanks
Consider the simple signal processing system shown in below fig, the sampling periods of the A/D and D/A converters T = 5 ms and T' = 1 ms, respectively. Determine the output ya(t) of the system, if the input is x_a(t) = 3 cos 100pi t + 2 sin 250pi t
thanks
Consider the simple signal processing system shown in below fig, the sampling periods of the A/D and D/A converters T = 5 ms and T' = 1 ms, respectively. Determine the output ya(t) of the system, if the input is x_a(t) = 3 cos 100pi t + 2 sin 250pi t
 A Digital Signal Processing system is taking at its input the following analogue signal s(t); s(t) - 20+ 20 cos(24xt)cos(xt), Where time t is expressed in ms. Part 1 - Setting the sampling frequency: (11 Marks) As a start, the system comprises only a sampler and an ideal analogue reconstructor as follows: w(t) s(t) Sampler Analogue Reconstructor s,(t) Figure a) Find the frequency spectrum S(t) of s(t) and deduce its bandwidth. You may directly use the table provided at the...
 onsider the sampling and reconstruction system shown in the figure. x(t) IdealIdeal) D-to-C Converter Converter Assume that the sampling rates of the C-to-D and D-to-C converters are equal, and the input to the Ideal C-to-D converter is x(t) = 2 cos (2m(50)t +π) + cos(2π(150e) a. (5) If the output of the Ideal D-to-C converter is equal to the input x(t) i.e. ()2 cos (2m(50)t +7)+cos(2(150)) b. (5) If the sampling rate is fs = 250 samples/sec, determine the discrete-time...
 need problem 6.13 done.
12. The analog signal xa (t) = cos (100mt) + cos (120πt) led using natural sampling as shown in Fig. 6.18. The sampling rate used is f, -4 width of each pulse is τ = 0.5 ms. Write an analytical expression for the Fourier transform Xa (w) and sketch it. Find an analytical expression for X, () the Fourier transform of the naturally- sampled signal T, (t). a. c. Sketch the transform X, (w). 613. Repeat...
need problem 6.13 done.
12. The analog signal xa (t) = cos (100mt) + cos (120πt) led using natural sampling as shown in Fig. 6.18. The sampling rate used is f, -4 width of each pulse is τ = 0.5 ms. Write an analytical expression for the Fourier transform Xa (w) and sketch it. Find an analytical expression for X, () the Fourier transform of the naturally- sampled signal T, (t). a. c. Sketch the transform X, (w). 613. Repeat...
 just looking for #2, 3, and 4
Problems: 1. Consider the system shown below. Let the input signal to the Ideal Sampler to be: s(t) = 2 cos(2m50t) + 4cos(2m100t) a. (10 points) Determine S(f) and plot it b. (20 points) Let the sampling rate to be: fs 300 samples/sec. Plot the spectrum of the Ideal sample, that is plot S8(f) c. Let the sampling rate to be: fs 175 samples/sec. i. (30 points) Plot S8(f) ii. (10 points) Let...
just looking for #2, 3, and 4
Problems: 1. Consider the system shown below. Let the input signal to the Ideal Sampler to be: s(t) = 2 cos(2m50t) + 4cos(2m100t) a. (10 points) Determine S(f) and plot it b. (20 points) Let the sampling rate to be: fs 300 samples/sec. Plot the spectrum of the Ideal sample, that is plot S8(f) c. Let the sampling rate to be: fs 175 samples/sec. i. (30 points) Plot S8(f) ii. (10 points) Let...
 3. (a) Consider the signal xc(t)-sin(2π(40)t). How fast must xe(t) be sanpled to avoid aliasing? Determine the Nyquist rate (the frequency which the sampling rate fs must exceed) for ae(t) (b) Consider processing the signal xe(t) (from part (a)) using the system shown below: Conversion to a sequence Conversion to an impulse train Ideal Reconstruction Filter Hr(ju) p (t) ур y(t) The sampling period for this system is T-1/50 seconds. The DT system H(ei2) is an ideal lowpass filter with...
 5. [20 marks Consider the RC series circuit shown in Fig. 3. Determine the overall output y(t). Determine the steady state output, yss(t), of the circuit if the input signal is given by r(t) = sin (3t) u(t) x(t) = sin(31) C = 0.5 μF Figure 3: RC series circuit for Q5
 3: (Practice Problem)Consider the representation of the process of sampling followed by reconstruction shown below oce=nt) C) Assume that the input signal is Ia(t) = 2 cos(100nt – /4) + cos(300nt + 7/3) -0<t< The frequency response of the reconstruction filter is H.(12) = {T 121</T 10 1921 > A/T (a) Determine the continuous-time Fourier transform X (12) and plot it as a function of N. (b) Assume the fs = 1/T = 500 samples/sec and plot the Fourier transform...
 Consider a sampler which samples the continuous-time input signal x(t) at a sampling frequency fs = 8000 Hz and produces at its output a sampled discrete-time signal x$(t) = x(nTs), where To = 1/fs is the sampling period. If the sampled signal is passed through a unity-gain lowpass filter with cutoff frequency of fs/2, sketch the magnitude spectrum of the resulting signal for the following input signals: (a) x(t) = cos(6000nt). (b) x(t) = cos(12000nt). (c) x(t) = cos(18000nt).
 c) An excitation signal x(t) of
frequency contents shown below is input to the communication system
shown below Find and draw the output signal y(t) or Y().
# if the draw using MATLAB with the code will be better
c) An excitation signal x(t) of frequency contents shown below X(@) 2W 2W is input to the communication system shown below e(t) v(t) 0 -3w 3w cos(5wt) coe(3wt) Find and draw the output signal ) or Y(a).
c) An excitation signal...
c) An excitation signal x(t) of
frequency contents shown below is input to the communication system
shown below Find and draw the output signal y(t) or Y().
# if the draw using MATLAB with the code will be better
c) An excitation signal x(t) of frequency contents shown below X(@) 2W 2W is input to the communication system shown below e(t) v(t) 0 -3w 3w cos(5wt) coe(3wt) Find and draw the output signal ) or Y(a).
c) An excitation signal...
Most questions answered within 3 hours.
-
Where is the error in this code sequence?
String s1 = "Hello";
String s2 = "ello";...
asked 10 months ago -
Financial data for Joel de Paris, Inc., for last year
follow:
Joel de Paris, Inc.
Balance...
asked 10 months ago -
Consider this reaction:
Al2(SO4)3 (aq)+ BaCl3
(aq) Al2Cl6 (aq)- +
3BaSO4(s) . What is the...
asked 10 months ago -
Suppose that Savneet is considering increasing her
recent random sample from 20 car rentals to 40...
asked 10 months ago -
Trucks arrive at an unloading terminal at an average rate of 120
per hour.
Trucks arrive...
asked 10 months ago -
Why are methanol and ethanol completely soluble in water while
octanol is not very little soluble....
asked 10 months ago -
A facilities manager at a university reads in a research report
that the mean amount of...
asked 10 months ago -
When the CuSO4 is rehydrated by adding water to the anhydrous
compound, is this an endothermic...
asked 10 months ago -
A ray of sunlight is passing from diamond into crown glass; the
angle of incidence is...
asked 10 months ago -
A block of mass 0.249 kg is placed on top of a light, vertical
spring of...
asked 10 months ago -
how do the kidneys compensate in the presences of acidosis
a) trigger hyperventilate
b) reserve acid...
asked 10 months ago -
Question 501 pts
The rental rate of capital to the firm increases. Which of the
following...
asked 10 months ago