business economics
Plot the following combinations of Good X and Good Y on the graph below. Draw the PPC.
a. Calculate the cost of increasing production of good X from 0 to 10 units,
as measured in the amount of good Y that would need to be sacrificed
b. Calculate the cost of increasing production of good X from 10 to 20 units,
as measured in the amount of good Y that would need to be sacrificed
c. Calculate the cost of increasing production of good X from 20 to 30 units,
as measured in the amount of good Y that would need to be sacrificed
d. What happens to the opportunity cost as the production of good X increases?
e. What happens to the opportunity cost as the production of good Y increases?
f. Plot the PPC for Good X and Good Y.


Homework Answers
The production possibility curve:
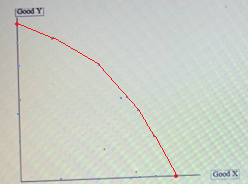
a. Cost of inceasing production of Good X from 0 to 10 units = 4 units of Good Y.
reason when 0 units of Good X are produced, 40 units of Good Y can be produced. But to produce 10 units of Good x, the production of Good Y must fall by 4 units (form 40 to 36).
b. Cost of inceasing production of Good X from 10 to 20 units = 7 units of Good Y.
reason: when 10 units of Good X are produced, 36 units of Good Y can be produced. But to produce 20 units of Good X, the production of Good Y must fall by 4 units (from 36 to 29).
c. Cost of inceasing production of Good X from 20 to 30 units = 12 units of Good Y.
reason when 20 units of Good X are produced, 29 units of Good Y can be produced. But to produce 30 units of Good X, the production of Good Y must fall by 12 units (from 29 to 17).
d. As the production of Good X increases, the opportunity cost increases. This indicates the increasing cost of production of Good X.
In the accompanying graph construct a production possibilities curve for a nation with the following maximum...
 In the accompanying graph construct a production possibilities curve for a nation with the following maximum output combinations. The Production Possibilities Curve Food ideo Games 0 10 10 16 19 1.) Using the point drawing tool, plot the four output combinations from the table above. Properly label each point. 2.) Using the 4-point curved Nne drewing tool, draw a curve connecting these points. Label this curve Carefuly towow the instructions above, and only draw the required abjects The shape of...
Econ 201 Introduction to Microeconomics IN CLASS ASSIGNMENT 1 . Consider an economy called Choiceland that...
 Econ 201 Introduction to Microeconomics IN CLASS ASSIGNMENT 1 . Consider an economy called Choiceland that has 250 workers and produces only two goods, X and Y. Labour is the only factor of production, but some workers are better suited to producing X than Y (and vice versa). The table below shows the maximum levels of output of each good possible from various levels of labour input. Number of Workers Producing X Annual Production of Y Number of Workers Annual...
ECON 2303 HW I SP 20 A production possibilities table for bananas and apples is shown...
 ECON 2303 HW I SP 20 A production possibilities table for bananas and apples is shown below. Type of Production Bananas (in pounds) Apples (in pounds) A 0 100 Production Alternatives B C D 20 40 60 75 50 25 E 80 0 a. Show these data graphically. Instructions: Use the tool provided PPC to draw a PPC curve (plot 5 points total). Apples (in pounds) 0 80 100 20 40 60 Bananas (in pounds) b. Does the economy above...
7. Working with Numbers and Graphs Q9 The following table summarizes the combinations of goods X...
 7. Working with Numbers and Graphs Q9 The following table summarizes the combinations of goods X and Y that two individuals, Tina and David, can each produce individually. Tina David X Y X Y 150 0 200 0 75 37.5 100 10 0 75 0 20 would specialize in the If each person specializes in the production of the good for which they have the comparative advantage, then would specialize in the production of good X. (Hint: Calculate the opportunity...
Suppose the following data reflect the production possibilities for providing health care and education, graph the...
Suppose the following data reflect the production possibilities for providing health care and education, graph the PPC and answer two questions about production possibilities and opportunity cost. a. Graph the production possibilities curve. Healthcare Education 400 0 370 20 330 40 270 50 190 60 100 70 0 80 b. If maximum health care is provided, how much education will be provided? units of education c. What is the opportunity cost of increasing health care from 190 to 270 units?...
Question 5 What can be used to explain why countries may not always benefit from the...
Question 5 What can be used to explain why countries may not always benefit from the specialization in producing fewer goods and services? Question 5 options: For a given firm, producing at an extremely high scale may embrace higher average cost of production. For a given firm, producing at an extremely high scale should cause the total production cost to be greater than the total revenue. For a given country, producing fewer products at extremely high production scales should lower...
Draw a Production Possibilities Graph for Apple using the following information. A B C D E...
Draw a Production Possibilities Graph for Apple using the following information. A B C D E F G iPhone 0 20 28 35 40 43 45 iPad 56 54 51 45 37 27 0 What are the consequences of Apple producing at combination A? What about combination G? Are these combinations productively efficient, allocatively efficient or both? Explain. Plot the combination 43 iPhones and 50 iPads and label it “X.” Plot the combination 30 iPhones and 40 iPads and label...
The following table summarizes the combinations of goods X and Y that two individuals, Tina and...
 The following table summarizes the combinations of goods X and Y that two individuals, Tina and David, can each produce individually. Tina X Y 1000 50 5 0 10 David XY 1500 75 37.5 0 75 fesch person specializes in the production of the good for which they have the comparative advantage, then would specialize in the production of good Y, and would specialize in the production of good X. (Hint: Calculate the opportunity cost of producing X and Y...
A production possibilities table for DVDs and computers is shown below Production Alternatives Type of Production...
 A production possibilities table for DVDs and computers is shown below Production Alternatives Type of Production A Computers DVDs 0 20 40 60 80 80 70 35 a. Show these data graphically, and then identify a point that indicates an inefficient use of resources and a point that indicates an unattainable combination of goods Instructions: Use the tool provided 'PPC to draw a PPC curve (plot 5 points total) b. Does the economy above demonstrate the law of increasing opportunity cost?
 In the accompanying graph construct a production possibilities curve for a nation with the following maximum output combinations. The Production Possibilities Curve Food ideo Games 0 10 10 16 19 1.) Using the point drawing tool, plot the four output combinations from the table above. Properly label each point. 2.) Using the 4-point curved Nne drewing tool, draw a curve connecting these points. Label this curve Carefuly towow the instructions above, and only draw the required abjects The shape of...
 Econ 201 Introduction to Microeconomics IN CLASS ASSIGNMENT 1 . Consider an economy called Choiceland that has 250 workers and produces only two goods, X and Y. Labour is the only factor of production, but some workers are better suited to producing X than Y (and vice versa). The table below shows the maximum levels of output of each good possible from various levels of labour input. Number of Workers Producing X Annual Production of Y Number of Workers Annual...
 ECON 2303 HW I SP 20 A production possibilities table for bananas and apples is shown below. Type of Production Bananas (in pounds) Apples (in pounds) A 0 100 Production Alternatives B C D 20 40 60 75 50 25 E 80 0 a. Show these data graphically. Instructions: Use the tool provided PPC to draw a PPC curve (plot 5 points total). Apples (in pounds) 0 80 100 20 40 60 Bananas (in pounds) b. Does the economy above...
 7. Working with Numbers and Graphs Q9 The following table summarizes the combinations of goods X and Y that two individuals, Tina and David, can each produce individually. Tina David X Y X Y 150 0 200 0 75 37.5 100 10 0 75 0 20 would specialize in the If each person specializes in the production of the good for which they have the comparative advantage, then would specialize in the production of good X. (Hint: Calculate the opportunity...
 The following table summarizes the combinations of goods X and Y that two individuals, Tina and David, can each produce individually. Tina X Y 1000 50 5 0 10 David XY 1500 75 37.5 0 75 fesch person specializes in the production of the good for which they have the comparative advantage, then would specialize in the production of good Y, and would specialize in the production of good X. (Hint: Calculate the opportunity cost of producing X and Y...
 A production possibilities table for DVDs and computers is shown below Production Alternatives Type of Production A Computers DVDs 0 20 40 60 80 80 70 35 a. Show these data graphically, and then identify a point that indicates an inefficient use of resources and a point that indicates an unattainable combination of goods Instructions: Use the tool provided 'PPC to draw a PPC curve (plot 5 points total) b. Does the economy above demonstrate the law of increasing opportunity cost?
Most questions answered within 3 hours.
-
Where is the error in this code sequence?
String s1 = "Hello";
String s2 = "ello";...
asked 10 months ago -
Financial data for Joel de Paris, Inc., for last year
follow:
Joel de Paris, Inc.
Balance...
asked 10 months ago -
Consider this reaction:
Al2(SO4)3 (aq)+ BaCl3
(aq) Al2Cl6 (aq)- +
3BaSO4(s) . What is the...
asked 10 months ago -
Suppose that Savneet is considering increasing her
recent random sample from 20 car rentals to 40...
asked 10 months ago -
Trucks arrive at an unloading terminal at an average rate of 120
per hour.
Trucks arrive...
asked 10 months ago -
Why are methanol and ethanol completely soluble in water while
octanol is not very little soluble....
asked 10 months ago -
A facilities manager at a university reads in a research report
that the mean amount of...
asked 10 months ago -
When the CuSO4 is rehydrated by adding water to the anhydrous
compound, is this an endothermic...
asked 10 months ago -
A ray of sunlight is passing from diamond into crown glass; the
angle of incidence is...
asked 10 months ago -
A block of mass 0.249 kg is placed on top of a light, vertical
spring of...
asked 10 months ago -
how do the kidneys compensate in the presences of acidosis
a) trigger hyperventilate
b) reserve acid...
asked 10 months ago -
Question 501 pts
The rental rate of capital to the firm increases. Which of the
following...
asked 10 months ago