
Homework Answers

Add Answer to:
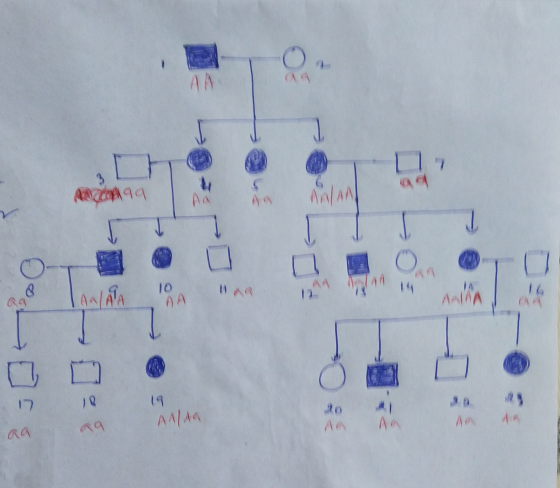
Use this pedigree to answer the questions below. 102 30 80 1 15 116 17 18...
Genetics Pedigree Worksheet 1. Use the below pedigree chart to answer the following questions about dimples....
 Genetics Pedigree Worksheet 1. Use the below pedigree chart to answer the following questions about dimples. The Dimple gene controls whether a person has dimples or doesn't have dimples. Dimples is dominant to no dimples. Place the genotypes of each individual below its symbol. O Dimples gene (D) Dimples is dominant to no dimples 12 13 14 A) How many family members have Dimples? B) What is the genotype of individual 3 and 4? C) Can cither individual #8 or...
10. Study the Pedigree chart below. Answer the questions that follow. 7 * Type A -...
 10. Study the Pedigree chart below. Answer the questions that follow. 7 * Type A - Type B = Type AB - Type o 8 9 10 11 12 13 14 15 16 17 18 19 20 21 a. How many phenotypes are shown? b. What type of inheritance is blood type? c. The genotypes for blood groups are as follows: Type A: AA or Ao Type B: BB or Bo Type AB: AB Type 0:00 d. Using these genotypes,...
14 24 18 23 21 18 16 14 23 17 15 13 19 23 24 14...
14 24 18 23 21 18 16 14 23 17 15 13 19 23 24 14 16 26 21 14 15 22 16 12 20 23 19 26 20 25 21 19 21 25 23 25 25 19 20 15 (a) Develop a frequency distribution using classes of 12-14, 15-17, 18-20, 21-23, and 24-26. Class Frequency 12-14 15-17 18-20 21-23 24-26 Total (b) Develop a relative frequency distribution and a percent frequency distribution using the classes in part (a). If...
Please write in the answer clear. Will leave like if its correct . Age Gen Sibs Work Exercise Units Mom 18 M 1 20 10 15 6 17 F 3 0 7 15 14 23 M...
 Please write in the answer clear. Will leave like if its
correct
.
Age
Gen
Sibs
Work
Exercise
Units
Mom
18
M
1
20
10
15
6
17
F
3
0
7
15
14
23
M
3
20
5
13
8
20
M
2
0
5
15
16
18
F
4
22
6
16
9
20
F
2
11
7
20
20
34
F
1
48
10
10
18
22
F
3
37
13
13
18
19
M
3
0...
Please write in the answer clear. Will leave like if its
correct
.
Age
Gen
Sibs
Work
Exercise
Units
Mom
18
M
1
20
10
15
6
17
F
3
0
7
15
14
23
M
3
20
5
13
8
20
M
2
0
5
15
16
18
F
4
22
6
16
9
20
F
2
11
7
20
20
34
F
1
48
10
10
18
22
F
3
37
13
13
18
19
M
3
0...
Game Point_Differential Assists Rebounds Turnovers Personal_Fouls 1 15 15 38 11 9 2 36 20 43 &
 Game
Point_Differential Assists
Rebounds Turnovers Personal_Fouls
1 15 15 38
11 9
2 36 20 43
8 13
3 16 21 29
7 13
4 45 22 46
11 11
5 12 11 40
7 22
6 -10 10 31
13 26
7 11 19 45
11 7
8 12 16 32
16 14
9 3 16 27
18 15
10 19 9 34
17 17
11 40 16 41
9 17
12 44 12 29
9 22
13 16 ...
Game
Point_Differential Assists
Rebounds Turnovers Personal_Fouls
1 15 15 38
11 9
2 36 20 43
8 13
3 16 21 29
7 13
4 45 22 46
11 11
5 12 11 40
7 22
6 -10 10 31
13 26
7 11 19 45
11 7
8 12 16 32
16 14
9 3 16 27
18 15
10 19 9 34
17 17
11 40 16 41
9 17
12 44 12 29
9 22
13 16 ...
mendand drain which he n dada 14 15 16 17 18 19 14 15 16 17...
 mendand drain which he n dada 14 15 16 17 18 19 14 15 16 17 18 19 14 15 16 17 18 19 A) Greatest sample standard deviation: Least sample standard deviation ) B) Greatest sample standard deviation: Least sample standard deviation: () Greatest sample standard deviation (1) Least sample standard deviation (1) D) Greatest sample standard deviation: Least sample standard deviation: () 15) Classify the statement as an example of classical probability, empirical probability or subjective probability. The...
For Questions 1-2, use table below. It is data for two stocks over 30 days (it...
For Questions 1-2, use table below. It is data for two stocks over 30 days (it is sample data). Day High stock Sky stock Day High stock Sky stock 1 27 60 16 43 39 2 33 57 17 45 37 3 34 56 18 46 35 4 35 55 19 47 34 5 36 54 20 47 32 6 37 51 21 48 29 7 38 50 22 50 26 8 38 47 23 50 26 9 39 47...
Cork price: 16 10 15 10 17 11 14 13 11 14 11 16 18 16...
Cork price: 16 10 15 10 17 11 14 13 11 14 11 16 18 16 10 17 14 14 16 7 10 12 19 15 16 14 9 12 21 13 10 16 12 16 13 17 17 13 14 18 11 12 15 16 13 18 16 17 12 12 14 9 11 14 19 13 11 17 11 13 15 14 18 18 18 12 10 11 13 14 11 14 18 13 13 19 17 14...
3 4 5 7 8 9 10 11 12 13 14 15 16 17 18 1920...
 3 4 5 7 8 9 10 11 12 13 14 15 16 17 18 1920 21 22 23 Question Unit Tutorials If you need help Question 24 O Mark this question Which statement below is NOT true regarding process mapping? O Process mapping forms a foundation for efficiency evaluation O Process mapping is used for evaluating sustainable business solutions. O A process map is a visual representation of the stages in a process. O Almost all business practices and...
x 1 11 20 16 19 15 16 10 x2 17 21 17 21 19 21...
 x 1 11 20 16 19 15 16 10 x2 17 21 17 21 19 21 14 x3 19 22 21 22 24 23 X4 25 16 17 18 18 x5 26 18 18 22 21 Test at a = 0.10 to determine if the population means are all the same. 1. The null hypothesis is Ho: OM = M2 = M3 = Hy = 45 Oui = ly = H3 = 44 OH = H2 = 43 2. This...
 Genetics Pedigree Worksheet 1. Use the below pedigree chart to answer the following questions about dimples. The Dimple gene controls whether a person has dimples or doesn't have dimples. Dimples is dominant to no dimples. Place the genotypes of each individual below its symbol. O Dimples gene (D) Dimples is dominant to no dimples 12 13 14 A) How many family members have Dimples? B) What is the genotype of individual 3 and 4? C) Can cither individual #8 or...
 10. Study the Pedigree chart below. Answer the questions that follow. 7 * Type A - Type B = Type AB - Type o 8 9 10 11 12 13 14 15 16 17 18 19 20 21 a. How many phenotypes are shown? b. What type of inheritance is blood type? c. The genotypes for blood groups are as follows: Type A: AA or Ao Type B: BB or Bo Type AB: AB Type 0:00 d. Using these genotypes,...
 Please write in the answer clear. Will leave like if its
correct
.
Age
Gen
Sibs
Work
Exercise
Units
Mom
18
M
1
20
10
15
6
17
F
3
0
7
15
14
23
M
3
20
5
13
8
20
M
2
0
5
15
16
18
F
4
22
6
16
9
20
F
2
11
7
20
20
34
F
1
48
10
10
18
22
F
3
37
13
13
18
19
M
3
0...
Please write in the answer clear. Will leave like if its
correct
.
Age
Gen
Sibs
Work
Exercise
Units
Mom
18
M
1
20
10
15
6
17
F
3
0
7
15
14
23
M
3
20
5
13
8
20
M
2
0
5
15
16
18
F
4
22
6
16
9
20
F
2
11
7
20
20
34
F
1
48
10
10
18
22
F
3
37
13
13
18
19
M
3
0...
 Game
Point_Differential Assists
Rebounds Turnovers Personal_Fouls
1 15 15 38
11 9
2 36 20 43
8 13
3 16 21 29
7 13
4 45 22 46
11 11
5 12 11 40
7 22
6 -10 10 31
13 26
7 11 19 45
11 7
8 12 16 32
16 14
9 3 16 27
18 15
10 19 9 34
17 17
11 40 16 41
9 17
12 44 12 29
9 22
13 16 ...
Game
Point_Differential Assists
Rebounds Turnovers Personal_Fouls
1 15 15 38
11 9
2 36 20 43
8 13
3 16 21 29
7 13
4 45 22 46
11 11
5 12 11 40
7 22
6 -10 10 31
13 26
7 11 19 45
11 7
8 12 16 32
16 14
9 3 16 27
18 15
10 19 9 34
17 17
11 40 16 41
9 17
12 44 12 29
9 22
13 16 ...
 mendand drain which he n dada 14 15 16 17 18 19 14 15 16 17 18 19 14 15 16 17 18 19 A) Greatest sample standard deviation: Least sample standard deviation ) B) Greatest sample standard deviation: Least sample standard deviation: () Greatest sample standard deviation (1) Least sample standard deviation (1) D) Greatest sample standard deviation: Least sample standard deviation: () 15) Classify the statement as an example of classical probability, empirical probability or subjective probability. The...
 3 4 5 7 8 9 10 11 12 13 14 15 16 17 18 1920 21 22 23 Question Unit Tutorials If you need help Question 24 O Mark this question Which statement below is NOT true regarding process mapping? O Process mapping forms a foundation for efficiency evaluation O Process mapping is used for evaluating sustainable business solutions. O A process map is a visual representation of the stages in a process. O Almost all business practices and...
 x 1 11 20 16 19 15 16 10 x2 17 21 17 21 19 21 14 x3 19 22 21 22 24 23 X4 25 16 17 18 18 x5 26 18 18 22 21 Test at a = 0.10 to determine if the population means are all the same. 1. The null hypothesis is Ho: OM = M2 = M3 = Hy = 45 Oui = ly = H3 = 44 OH = H2 = 43 2. This...
Most questions answered within 3 hours.
-
Where is the error in this code sequence?
String s1 = "Hello";
String s2 = "ello";...
asked 10 months ago -
Financial data for Joel de Paris, Inc., for last year
follow:
Joel de Paris, Inc.
Balance...
asked 10 months ago -
Consider this reaction:
Al2(SO4)3 (aq)+ BaCl3
(aq) Al2Cl6 (aq)- +
3BaSO4(s) . What is the...
asked 10 months ago -
Suppose that Savneet is considering increasing her
recent random sample from 20 car rentals to 40...
asked 10 months ago -
Trucks arrive at an unloading terminal at an average rate of 120
per hour.
Trucks arrive...
asked 10 months ago -
Why are methanol and ethanol completely soluble in water while
octanol is not very little soluble....
asked 10 months ago -
A facilities manager at a university reads in a research report
that the mean amount of...
asked 10 months ago -
When the CuSO4 is rehydrated by adding water to the anhydrous
compound, is this an endothermic...
asked 10 months ago -
A ray of sunlight is passing from diamond into crown glass; the
angle of incidence is...
asked 10 months ago -
A block of mass 0.249 kg is placed on top of a light, vertical
spring of...
asked 10 months ago -
how do the kidneys compensate in the presences of acidosis
a) trigger hyperventilate
b) reserve acid...
asked 10 months ago -
Question 501 pts
The rental rate of capital to the firm increases. Which of the
following...
asked 10 months ago