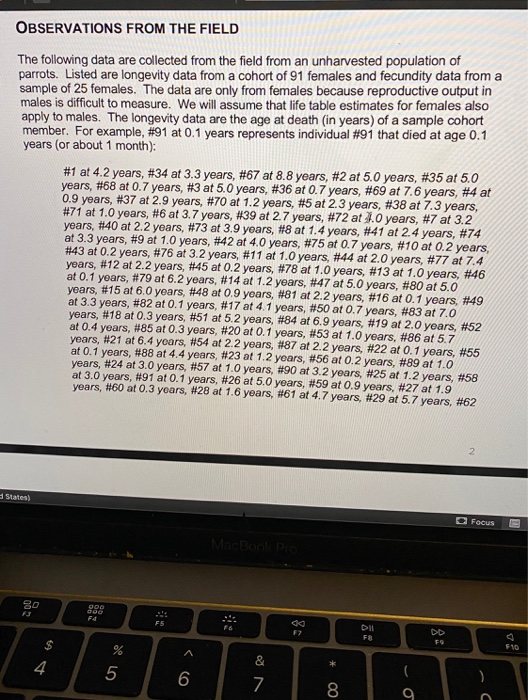
From these data you need to determine the number of individuals that survived to each age, starting with the original 91 at age 0.
Homework Answers
Data of 82 individuals are given and they are arranged according to the ages. The numbers represent the tag numbers of each bird not their ages.
For ex - 0.3 yrs -18,85,60. Here 0.4 yrs is the age of the individual and 18,85,60 are the tag numbers of the parrot .Thus a total of 3 individuals survive upto 0.3 yrs.
You can calculate the number of individuals thereby age wise.
0.1 yrs - 22, 55,91 , 46 , 16 , 82 , 20
0.2 yrs - 10, 43, 45,46
0.3 yrs - 18, 85,60
0.4 yrs- 52
0.7 yrs - 68,36,75,50
0.9 yrs- 4,48,59
1.0 - 71,9, 11,78,13, 53, 89, 57
1.2 yrs - 70,14,23,25
1.4 yrs - 8
1.6 yrs- 28
1.9 yrs- 27
2.0 yrs- 44, 19
2.2 yrs - 40, 12,81,54,87
2.3 yrs - 5
2.4 yrs- 41
2.7 yrs - 39
2.9 yrs - 37
3.0 yrs - 24, 58
3.2 yrs - 7, 76, 90
3.3 yrs - 34,74,49
3.7 yrs - 6
3.9 yrs - 73
4 yrs - 72, 42 (please check about number 72 since the age is not visible due to the cursor in your screenshot)
4.1 yrs - 17
4.2 yrs - 1
4.4 yrs - 88
4.7 yrs - 61
5.0 - 2, 35, 3, 47, 80, 26
5.2 yrs - 51
5.7 yrs - 86, 29
6.0 yrs - 15
6.2 yrs - 79
6.4 yrs - 21
6.9 yrs - 84
7.0 yrs - 83
7.3 yrs - 38
7.4 yrs - 77
7.6 yrs - 69
Add Answer to:
From these data you need
to determine the number of individuals that survived to each age,...
determine 1) the maximum stress in the bar if P=9kN. 3.0 3.2 2.8 WW 2.6 3.0...
 determine 1) the maximum stress in the bar if P=9kN.
3.0 3.2 2.8 WW 2.6 3.0 N W 2.4 N hi 2.8 2.2 svg (w - 21) K - 4.0 K 2.0 2.6 3.01 2.0 1.8 w IS 2.4 1.6 w h 1.2- 1.1 1.4 2.2 LATIN . 1.2 2.0 1.0 0 0.1 0.6 0.7 0.8 0.9 1.0 0.5 0.2 0.3 2r 0 0.4 0.5 0.1 0.2 0.3 0.4 h 3.2 mm 48 mm 32 mm Р P r =...
determine 1) the maximum stress in the bar if P=9kN.
3.0 3.2 2.8 WW 2.6 3.0 N W 2.4 N hi 2.8 2.2 svg (w - 21) K - 4.0 K 2.0 2.6 3.01 2.0 1.8 w IS 2.4 1.6 w h 1.2- 1.1 1.4 2.2 LATIN . 1.2 2.0 1.0 0 0.1 0.6 0.7 0.8 0.9 1.0 0.5 0.2 0.3 2r 0 0.4 0.5 0.1 0.2 0.3 0.4 h 3.2 mm 48 mm 32 mm Р P r =...
The following data were obtained from a 14ft (drill length) core in shale with discontinuities-bedding surface...
 The following data were obtained from a 14ft (drill length) core in shale with discontinuities-bedding surface and high angle joints. Measurements are in inches (in) 5.7 1.3 0.5 1.1 5.3 1.3 3.4 0.3 2.0 4.3 3.2 1.2 2.3 2.9 2,8 3,2 1.2 1.2 3.0 6.2 2.9 6.4 2.6 2.6 3.5 1.0 0.5 1.1 6.8 0.3 0.9 1.7 2.1 5,9 0.9 2.0 0.5 3.1 2.3 4.1 4.2 2.2 2.8 4.3 2.0 4.4 4.5 3.6 0.5 2.1 Calculate the core loss (15...
Use the following cell phone airport data speeds (Mbps) from a particular network. Find the percentile...
Use the following cell phone airport data speeds (Mbps) from a particular network. Find the percentile corresponding to the data speed 4.4 Mbps. 0.2 0.2 0.3 0.3 0.4 0.4 0.6 0.7 0.8 0.8 0.8 0.8 0.9 0.9 0.9 1.2 1.3 1.5 1.5 1.6 1.7 2.2 2.4 2.5 2.6 2.9 3.3 3.8 3.9 4.4 5.2 5.4 5.6 6.5 6.5 7.4 10.5 11.7 12.1 12.2 12.2 12.3 12.4 13.1 15.3 15.4 15.5 15.6 15.6 30.6 Percentile of 4.4= (Round to the nearest...
Consider the pressure gauge calibration data given below. What is the range of the gauge? Plot...
 Consider the pressure gauge calibration data given below. What is the range of the gauge? Plot the data using a suitable scale (include a print out of the excel, matlab, etc program used to create the graph). Identify the location of maximum hysteresis error and then express that error as a percent of full-scale. Increasing In Decreasing In Input (Standard) 0.0 Gauge Ou 2.0 3.0 4.0 5.0 0.1 1.1 2.1 3.0 Input (Standard) 5.0 4.0 3.0 2.0 1.0 0.0 Gauge...
use the following cell phone airport data speeds (mbps) from a particular network. find the percentiles...
use the following cell phone airport data speeds (mbps) from a particular network. find the percentiles corresponding to the data speed 3.7 mbps. 0.1 0.1 0.2 0.2 0.3 0.3 0.3 0.3 0.3 0.4 0.7 0.7 0.8 0.8 0.9 1.4 1.4 1.5 1.5 1.5 1.6 1.8 2.3 2.5 2.5 2.7 2.8 2.8 3.3 3.3 3.7 4.6 4.6 4.8 5.2 7.4 7.8 8.5 8.7 8.9 9.1 9.2 9.5 11.1 12.7 12.8 13.7 13.9 15.6 27.4
Use the following cell phone airport data speeds (Mbps) from a particular network. Find the percentile...
 Use the following cell phone airport data speeds (Mbps) from a particular network. Find the percentile corresponding to the data speed 1.1 Mbps. 0.1 0.2 0.3 0.4 0.5 0.6 0.1 0.7 1.5 0.1 0.7 1.5 4.8 9.7 0.8 2.2 0.2 0.9 2.3 6.4 0.9 2.4 0.8 1.8 5.5 11.2 0.3 0.9 2.6 7.9 1.7 1.1 2.9 8.4 14.6 1.5 3.1 8.6 15.5 3.8 8.7 6.7 5.3 10.5 5.6 11.2 11.6 11.6 12.2 30.6 Percentile of 1.1 = (Round to the...
Use the following cell phone airport data speeds (Mbps) from a particular network. Find the percentile...
Use the following cell phone airport data speeds (Mbps) from a particular network. Find the percentile corresponding to the data speed 8.8 Mbps. 0.1 0.2 0.3 0.3 0.4 0.4 0.4 0.5 0.5 0.6 0.6 0.6 0.6 0.7 0.7 0.9 0.9 1.1 1.2 1.3 1.3 1.3 1.8 2.4 2.7 2.7 2.8 2.9 3.3 3.9 4.2 4.4 4.7 5.4 6.7 7.2 8.2 8.5 8.6 8.7 8.8 9.4 11.1 11.6 11.8 11.9 13.1 13.8 15.6 29.1 Percentile of 8.8equals nothing (Round to the...
Use the following cell phone airport data speeds (Mbps) from a particular network. Find Upper Q...
Use the following cell phone airport data speeds (Mbps) from a particular network. Find Upper Q 3. 0.1 0.1 0.2 0.2 0.2 0.2 0.2 0.4 0.4 0.6 0.6 0.7 0.8 0.9 0.9 1.1 1.2 1.2 1.6 1.9 2.1 2.2 2.2 2.3 2.4 2.8 3.1 3.6 3.9 3.9 4.1 5.4 6.1 6.1 6.5 7.1 8.6 8.7 8.7 9.8 10.2 10.7 11.5 13.1 13.4 14.2 14.4 14.4 14.9 30.1 Upper Q 3equals nothing Mbps (Type an integer or a decimal. Do not...
To decide on the number of service counters needed for stores to be built in the...
 To decide on the number of service counters needed for stores to be built in the future, a supermarket chain wanted to obtain information on the length of time (in minutes) required to service customers. To find the distribution of customer service times, a sample of 60 customers' service times was recorded and are shown here. 0.5 1.2 5.2 1.2 0.4 3.7 0.3 0.2 3.1 1.6 0.6 2.3 1.8 0.4 2.8 1.2 1.0 1.3 1.0 0.8 1.9 1.0 0.5 1.0...
Use the following cell phone airport data speeds (Mbps) from a particular network. Find Upper Q...
Use the following cell phone airport data speeds (Mbps) from a particular network. Find Upper Q 1 0.2 0.2 0.3 0.4 0.4 0.5 0.5 0.5 0.6 0.7 0.7 0.7 0.7 0.9 0.9 0.9 0.9 1.3 1.4 1.8 1.8 1.9 2.2 2.3 2.3 2.3 2.6 3.1 3.3 3.8 4.2 4.7 5.5 6.8 7.3 8.4 9.5 11.7 12.5 12.7 13.5 13.6 13.8 13.9 14.3 14.4 14.6 14.7 15.5 25.6 Upper Q Mbps (Type an integer or a decimal. Do not round.)
 determine 1) the maximum stress in the bar if P=9kN.
3.0 3.2 2.8 WW 2.6 3.0 N W 2.4 N hi 2.8 2.2 svg (w - 21) K - 4.0 K 2.0 2.6 3.01 2.0 1.8 w IS 2.4 1.6 w h 1.2- 1.1 1.4 2.2 LATIN . 1.2 2.0 1.0 0 0.1 0.6 0.7 0.8 0.9 1.0 0.5 0.2 0.3 2r 0 0.4 0.5 0.1 0.2 0.3 0.4 h 3.2 mm 48 mm 32 mm Р P r =...
determine 1) the maximum stress in the bar if P=9kN.
3.0 3.2 2.8 WW 2.6 3.0 N W 2.4 N hi 2.8 2.2 svg (w - 21) K - 4.0 K 2.0 2.6 3.01 2.0 1.8 w IS 2.4 1.6 w h 1.2- 1.1 1.4 2.2 LATIN . 1.2 2.0 1.0 0 0.1 0.6 0.7 0.8 0.9 1.0 0.5 0.2 0.3 2r 0 0.4 0.5 0.1 0.2 0.3 0.4 h 3.2 mm 48 mm 32 mm Р P r =...
 The following data were obtained from a 14ft (drill length) core in shale with discontinuities-bedding surface and high angle joints. Measurements are in inches (in) 5.7 1.3 0.5 1.1 5.3 1.3 3.4 0.3 2.0 4.3 3.2 1.2 2.3 2.9 2,8 3,2 1.2 1.2 3.0 6.2 2.9 6.4 2.6 2.6 3.5 1.0 0.5 1.1 6.8 0.3 0.9 1.7 2.1 5,9 0.9 2.0 0.5 3.1 2.3 4.1 4.2 2.2 2.8 4.3 2.0 4.4 4.5 3.6 0.5 2.1 Calculate the core loss (15...
 Consider the pressure gauge calibration data given below. What is the range of the gauge? Plot the data using a suitable scale (include a print out of the excel, matlab, etc program used to create the graph). Identify the location of maximum hysteresis error and then express that error as a percent of full-scale. Increasing In Decreasing In Input (Standard) 0.0 Gauge Ou 2.0 3.0 4.0 5.0 0.1 1.1 2.1 3.0 Input (Standard) 5.0 4.0 3.0 2.0 1.0 0.0 Gauge...
 Use the following cell phone airport data speeds (Mbps) from a particular network. Find the percentile corresponding to the data speed 1.1 Mbps. 0.1 0.2 0.3 0.4 0.5 0.6 0.1 0.7 1.5 0.1 0.7 1.5 4.8 9.7 0.8 2.2 0.2 0.9 2.3 6.4 0.9 2.4 0.8 1.8 5.5 11.2 0.3 0.9 2.6 7.9 1.7 1.1 2.9 8.4 14.6 1.5 3.1 8.6 15.5 3.8 8.7 6.7 5.3 10.5 5.6 11.2 11.6 11.6 12.2 30.6 Percentile of 1.1 = (Round to the...
 To decide on the number of service counters needed for stores to be built in the future, a supermarket chain wanted to obtain information on the length of time (in minutes) required to service customers. To find the distribution of customer service times, a sample of 60 customers' service times was recorded and are shown here. 0.5 1.2 5.2 1.2 0.4 3.7 0.3 0.2 3.1 1.6 0.6 2.3 1.8 0.4 2.8 1.2 1.0 1.3 1.0 0.8 1.9 1.0 0.5 1.0...
Most questions answered within 3 hours.
-
Where is the error in this code sequence?
String s1 = "Hello";
String s2 = "ello";...
asked 10 months ago -
Financial data for Joel de Paris, Inc., for last year
follow:
Joel de Paris, Inc.
Balance...
asked 10 months ago -
Consider this reaction:
Al2(SO4)3 (aq)+ BaCl3
(aq) Al2Cl6 (aq)- +
3BaSO4(s) . What is the...
asked 10 months ago -
Suppose that Savneet is considering increasing her
recent random sample from 20 car rentals to 40...
asked 10 months ago -
Trucks arrive at an unloading terminal at an average rate of 120
per hour.
Trucks arrive...
asked 10 months ago -
Why are methanol and ethanol completely soluble in water while
octanol is not very little soluble....
asked 10 months ago -
A facilities manager at a university reads in a research report
that the mean amount of...
asked 10 months ago -
When the CuSO4 is rehydrated by adding water to the anhydrous
compound, is this an endothermic...
asked 10 months ago -
A ray of sunlight is passing from diamond into crown glass; the
angle of incidence is...
asked 10 months ago -
A block of mass 0.249 kg is placed on top of a light, vertical
spring of...
asked 10 months ago -
how do the kidneys compensate in the presences of acidosis
a) trigger hyperventilate
b) reserve acid...
asked 10 months ago -
Question 501 pts
The rental rate of capital to the firm increases. Which of the
following...
asked 10 months ago