Question 1: Tree Characteristics
For each tree below, is it a maxheap? Why or why not?
Tree A: 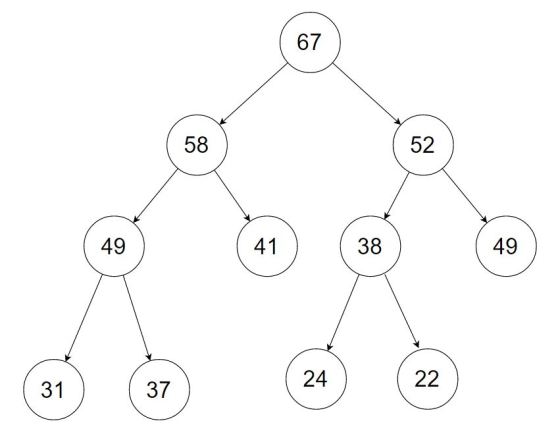
Tree B: 
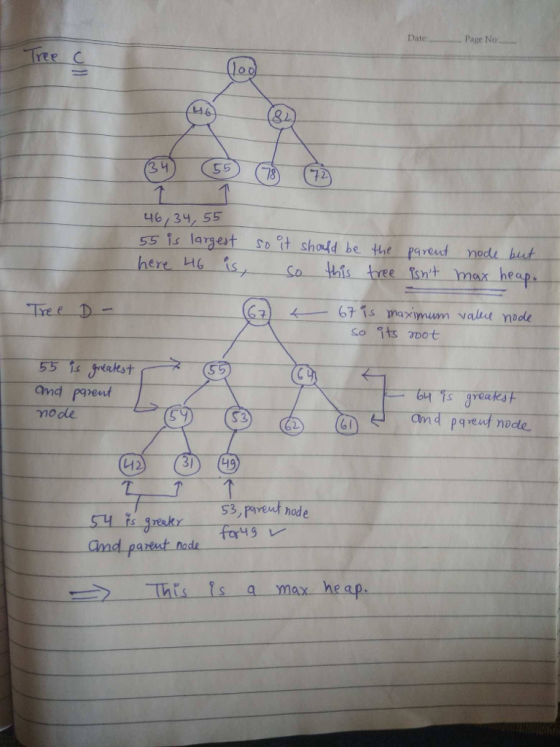
Tree C: 
Tree D: 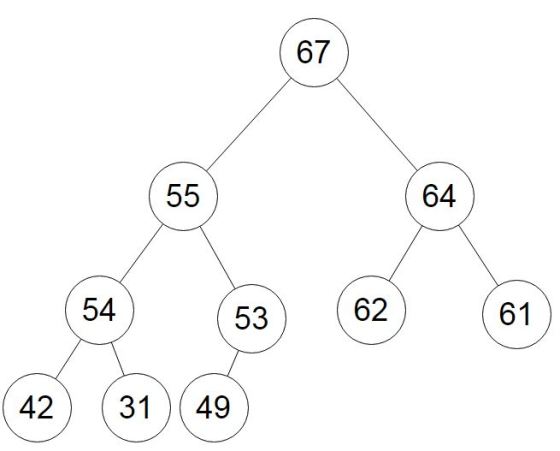
Homework Answers

Hope this helps!
Kindly appreciate the help by upvoting the answer. Thank you!
Add Answer to:
Question 1: Tree Characteristics
For each tree below, is it a maxheap? Why or why not?...
NUMBER OF PEOPLE 10.2 10.0 10.1 8.5 10.2 8.2 8 Source: United States Census. 11. In...
 NUMBER OF PEOPLE 10.2 10.0 10.1 8.5 10.2 8.2 8 Source: United States Census. 11. In the Sanitary District of Chicago, operating engineers are hired on of a competitive civil-service examination. In 1966, there were 223 appl for 15 jobs. The exam was held on March 12; the test scores are s arranged in increasing order. The height of each bar in the histogram next page) shows the number of people with the correspondin examiners were charged with rigging the...
Consider the below matrixA, which you can copy and paste directly into Matlab.
Problem #1: Consider the below matrix A, which you can copy and paste directly into Matlab. The matrix contains 3 columns. The first column consists of Test #1 marks, the second column is Test # 2 marks, and the third column is final exam marks for a large linear algebra course. Each row represents a particular student.A = [36 45 75 81 59 73 77 73 73 65 72 78 65 55 83 73 57 78 84 31 60 83...
estimate the average age at which multiple sclerosis patients were diagnosed with the condition for the...
estimate the average age at which multiple sclerosis patients were diagnosed with the condition for the first time in a given city. How big should the sample be? Define your procedures for this estimate (if necessary, set your own values of unknown parameters, based on statistical theory). In Table 1 you will find all ages of this patient population. 54 58 56 48 62 59 55 56 60 52 53 61 56 56 53 37 71 62 39 61 54...
Suppose a binary tree data (in tiny written size) is stored in an array (A) as...
Suppose a binary tree data (in tiny written size) is stored in an array (A) as given below and root is placed at “0”index. Note the array indices are in larger written size (0 to 74). Show the traversal data of the given tree for a) In-Order Traversal b) Post Order Traversal A 0 1 2 3 4 5 6 7 8 9 10 11 12 13 14 3 28 13 36 15 9 22 44 7 10 75 33 19 15...
#### Code in R ### mental.csv Pre.test Post.test Treat 72 74 Control 58 57 Control 66...
 #### Code in R ###
mental.csv
Pre.test
Post.test
Treat
72
74
Control
58
57
Control
66
74
Control
51
56
Control
30
28
Control
48
40
Control
58
61
Control
51
50
Control
38
40
Control
56
56
Control
68
72
Control
36
38
Control
53
53
Control
65
72
Control
32
24
Control
64
62
Control
58
55
025-050R
58
57
025-050R
56
57
025-050R
73
59
025-050R
49
42
025-050R
53
49
025-050R
28
29
025-050R
31
43...
#### Code in R ###
mental.csv
Pre.test
Post.test
Treat
72
74
Control
58
57
Control
66
74
Control
51
56
Control
30
28
Control
48
40
Control
58
61
Control
51
50
Control
38
40
Control
56
56
Control
68
72
Control
36
38
Control
53
53
Control
65
72
Control
32
24
Control
64
62
Control
58
55
025-050R
58
57
025-050R
56
57
025-050R
73
59
025-050R
49
42
025-050R
53
49
025-050R
28
29
025-050R
31
43...
Problem 4: Variables that may affect Grades The data set contains a random sample of STAT 250 Final Exam Scores out of 80 points. For each individual sampled, the time (in hours per week) that the stu...
Problem 4: Variables that may affect Grades The data set contains a random sample of STAT 250 Final Exam Scores out of 80 points. For each individual sampled, the time (in hours per week) that the student spent participating in a GMU club or sport and working for pay outside of GMU was recorded. Values of 0 indicate the students either does not participate in a club or sport or does not work a job for pay. The goal of...
Please show how you did this in excel. :13-19 Every home football game for the past...
 Please show how you did this in excel.
:13-19 Every home football game for the past eight years at Eastern State University has been sold out. The revenues from ticket sales are significant, but the sale of food, beverages, and souvenirs has contrib- uted greatly to the overall profitability of the football program. One particular souvenir is the football pro- gram for each game. The number of programs sold at each game is described by the following probabil- ity distribution:...
Please show how you did this in excel.
:13-19 Every home football game for the past eight years at Eastern State University has been sold out. The revenues from ticket sales are significant, but the sale of food, beverages, and souvenirs has contrib- uted greatly to the overall profitability of the football program. One particular souvenir is the football pro- gram for each game. The number of programs sold at each game is described by the following probabil- ity distribution:...
Problem 1: Confidence Interval for Percentage of B’s. The data set “STAT 250 Final Exam Scores”...
Problem 1: Confidence Interval for Percentage of B’s. The data set “STAT 250 Final Exam Scores” contains a random sample of 269 STAT 250 students’ final exam scores (maximum of 80) collected over the past two years. Answer the following questions using this data set. a) What proportion of students in our sample earned B’s on the final exam? A letter grade of B is obtained with a score of between 64 and 71 inclusive. Hint: You can do this...
Write a C program to assign natural numbers 1 to 100 into a one-dimensional integer array....
Write a C program to assign natural numbers 1 to 100 into a one-dimensional integer array. Display all the values in the array on the screen. For each number in the array, determine if the number contains digit 7 or is divisible by 7. Display all those numbers on the screen. Original array: 1 2 3 4 5 6 7 8 9 10 11 12 13 14 15 16 17 18 19 20 21 22 23 24 25 26 27...
1. Forecast demand for Year 4. a. Explain what technique you utilized to forecast your demand....
 1. Forecast demand for Year 4.
a. Explain what technique you utilized to forecast your
demand.
b. Explain why you chose this technique over others.
Year 3 Year 1 Year 2 Actual Actual Actual Forecast Forecast Forecast Demand Demand Demand Week 1 52 57 63 55 66 77 Week 2 49 58 68 69 75 65 Week 3 47 50 58 65 80 74 Week 4 60 53 58 55 78 67 57 Week 5 49 57 64 76 77...
1. Forecast demand for Year 4.
a. Explain what technique you utilized to forecast your
demand.
b. Explain why you chose this technique over others.
Year 3 Year 1 Year 2 Actual Actual Actual Forecast Forecast Forecast Demand Demand Demand Week 1 52 57 63 55 66 77 Week 2 49 58 68 69 75 65 Week 3 47 50 58 65 80 74 Week 4 60 53 58 55 78 67 57 Week 5 49 57 64 76 77...
 NUMBER OF PEOPLE 10.2 10.0 10.1 8.5 10.2 8.2 8 Source: United States Census. 11. In the Sanitary District of Chicago, operating engineers are hired on of a competitive civil-service examination. In 1966, there were 223 appl for 15 jobs. The exam was held on March 12; the test scores are s arranged in increasing order. The height of each bar in the histogram next page) shows the number of people with the correspondin examiners were charged with rigging the...
 #### Code in R ###
mental.csv
Pre.test
Post.test
Treat
72
74
Control
58
57
Control
66
74
Control
51
56
Control
30
28
Control
48
40
Control
58
61
Control
51
50
Control
38
40
Control
56
56
Control
68
72
Control
36
38
Control
53
53
Control
65
72
Control
32
24
Control
64
62
Control
58
55
025-050R
58
57
025-050R
56
57
025-050R
73
59
025-050R
49
42
025-050R
53
49
025-050R
28
29
025-050R
31
43...
#### Code in R ###
mental.csv
Pre.test
Post.test
Treat
72
74
Control
58
57
Control
66
74
Control
51
56
Control
30
28
Control
48
40
Control
58
61
Control
51
50
Control
38
40
Control
56
56
Control
68
72
Control
36
38
Control
53
53
Control
65
72
Control
32
24
Control
64
62
Control
58
55
025-050R
58
57
025-050R
56
57
025-050R
73
59
025-050R
49
42
025-050R
53
49
025-050R
28
29
025-050R
31
43...
 Please show how you did this in excel.
:13-19 Every home football game for the past eight years at Eastern State University has been sold out. The revenues from ticket sales are significant, but the sale of food, beverages, and souvenirs has contrib- uted greatly to the overall profitability of the football program. One particular souvenir is the football pro- gram for each game. The number of programs sold at each game is described by the following probabil- ity distribution:...
Please show how you did this in excel.
:13-19 Every home football game for the past eight years at Eastern State University has been sold out. The revenues from ticket sales are significant, but the sale of food, beverages, and souvenirs has contrib- uted greatly to the overall profitability of the football program. One particular souvenir is the football pro- gram for each game. The number of programs sold at each game is described by the following probabil- ity distribution:...
 1. Forecast demand for Year 4.
a. Explain what technique you utilized to forecast your
demand.
b. Explain why you chose this technique over others.
Year 3 Year 1 Year 2 Actual Actual Actual Forecast Forecast Forecast Demand Demand Demand Week 1 52 57 63 55 66 77 Week 2 49 58 68 69 75 65 Week 3 47 50 58 65 80 74 Week 4 60 53 58 55 78 67 57 Week 5 49 57 64 76 77...
1. Forecast demand for Year 4.
a. Explain what technique you utilized to forecast your
demand.
b. Explain why you chose this technique over others.
Year 3 Year 1 Year 2 Actual Actual Actual Forecast Forecast Forecast Demand Demand Demand Week 1 52 57 63 55 66 77 Week 2 49 58 68 69 75 65 Week 3 47 50 58 65 80 74 Week 4 60 53 58 55 78 67 57 Week 5 49 57 64 76 77...
Most questions answered within 3 hours.
-
Where is the error in this code sequence?
String s1 = "Hello";
String s2 = "ello";...
asked 11 months ago -
Financial data for Joel de Paris, Inc., for last year
follow:
Joel de Paris, Inc.
Balance...
asked 11 months ago -
Consider this reaction:
Al2(SO4)3 (aq)+ BaCl3
(aq) Al2Cl6 (aq)- +
3BaSO4(s) . What is the...
asked 11 months ago -
Suppose that Savneet is considering increasing her
recent random sample from 20 car rentals to 40...
asked 11 months ago -
Trucks arrive at an unloading terminal at an average rate of 120
per hour.
Trucks arrive...
asked 11 months ago -
Why are methanol and ethanol completely soluble in water while
octanol is not very little soluble....
asked 11 months ago -
A facilities manager at a university reads in a research report
that the mean amount of...
asked 11 months ago -
When the CuSO4 is rehydrated by adding water to the anhydrous
compound, is this an endothermic...
asked 11 months ago -
A ray of sunlight is passing from diamond into crown glass; the
angle of incidence is...
asked 11 months ago -
A block of mass 0.249 kg is placed on top of a light, vertical
spring of...
asked 11 months ago -
how do the kidneys compensate in the presences of acidosis
a) trigger hyperventilate
b) reserve acid...
asked 11 months ago -
Question 501 pts
The rental rate of capital to the firm increases. Which of the
following...
asked 11 months ago