
Homework Answers
A) Anova One-way test will be conducted to determine whether there are differences between the three groups because Anova is a statistical technique that is generally used to determine the difference between 2 or more groups using an F statistic.
Null Hypothesis Ho = There is no difference between the means scores of three groups
Alternate Hypothesis Ha = There is a significant difference between the scores of three groups
B) Here, n refers to the sample size for each group.
n for P.E. Test Scores Group 1 = 5
n for P.E. Test Scores Group 2 = 5
n for P.E. Test Scores Group 2 = 5
C) Following formula can be used to calculate the mean scores:

Mean Score (Group 1) = (100+99+87+97+92)/5 = 95
Mean Score (Group 2) = (90+87+95+97+91)/5 = 92
Mean Score (Group 3) = (88+82+98+90+96)/5 = 90.8
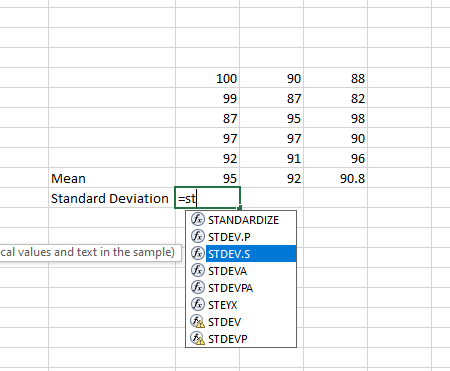
D) Following formula can be used to calculate the Standard Deviation:

However, Standard deviation can also be easily calculated by putting the data in excel and using =stdev.s command
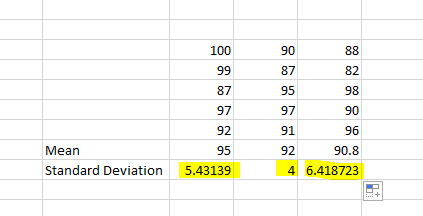
Therefore,
The standard deviation of Group 1 = 5.4313
The standard deviation of Group 2 = 4
The standard deviation of Group 3 = 6.4187
E) To calculate the test statistic, we can use excel to compute the value quickly:
Just put the data into a spreadsheet and go to data --> data analysis --> Anova: Single Factor
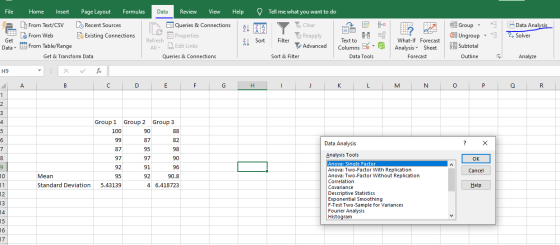


We got the f statistic value = 0.80
F) We are assuming the significance level to be 0.05.
The p value from the computation is p=0.46789 which is higher than significance level (0.05). Whenever, the calculate p value is more than significance level, we accept the null hypothesis.
This means that there is no difference between the mean scores of three groups.
Heyy! Please hit thumbs up, if you like the answer. Thanks
Add Answer to:
A P.E instructor has recently conducted a Physical Fitness test on three different groups of high...
19) ANOVA F test was conducted to test whether the means of three groups are the...
 19) ANOVA F test was conducted to test whether the means of three groups are the same against at least one group mean is different. The total number of subjects in three samples were 30. The Fratio (test statistics) was 4.25 a) What is the p-value? b) What is your conclusion at 5% significance level? Are all group means the same?
A university instructor uses different teaching methods on three separate computer science classes. The instructor wants...
 A university instructor uses different teaching methods on three separate computer science classes. The instructor wants to evaluate the effectiveness of the methods by comparing the grades between the classes. The grades have been transformed and are in the table below. What can the instructor conclude with a = 0.05? Method A Method B Method с 21 19 21 24 25 20 27 19 23 25 25 20 24 28 35 31 29 26 19 17 20 29 20 17...
Application Exercise: A university instructor uses different teaching methods on three separate computer science classes. The...
 Application Exercise: A university instructor uses different teaching methods on three separate computer science classes. The instructor wants to evaluate the effectiveness of the methods by comparing the grades between the classes. The grades have been transformed and are in the table below. What can the instructor conclude with an a of 0.01? Method A Method B Method с 21 19 21 25 25 20 24 19 17 20 23 20 17 20 34 22 29 26 a) What is...
Q2: Twenty third graders were randomly separated into 4 groups and each group was taught a...
Q2: Twenty third graders were randomly separated into 4 groups and each group was taught a mathematical concept using a different teaching method. At the end of the teaching period, progress was measured by a unit test. The scores of shown below: (one child in group three was absent of the day the test was administered.) (1) What type of design was used? (2) Construct an ANOVA table (3) Do the data present significant evidence to indicate a difference in...
In the United States, Scholastic Aptitude Test (SAT) scores are used by universities when selecting students for admission. Private companies and high schools offer SAT preparatory courses to help st...
 In the United States, Scholastic Aptitude Test (SAT) scores are used by universities when selecting students for admission. Private companies and high schools offer SAT preparatory courses to help students improve their scores. This has led some people to ask, "Do SAT preparatory classes effectively increase SAT scores?" The following study, cited in a major newspaper, claims that they do (but not by a substantial amount): "A new study . . . shows that [SAT preparatory] classes are effective in...
Question 21 You wish to co participants and administer a different test to each group. Which...
 Question 21 You wish to co participants and administer a different test to each group. Which analysis should you use? mpare the results from three different personality tests. You get three groups of O two-way ANOVA 。x' goodness-of-fit t test one-way ANOVA Question 22 When we say that a result is statistically significant, we mean that we have rejected the alternative hypothesis a strong relationship was shown. O the results were too unlikely to have occurred by chance if the...
A researcher is interested in seeing if different study techniques can influence test scores. An experiment was designed in which students are randomly assigned to one of three groups based on how the...
A researcher is interested in seeing if different study techniques can influence test scores. An experiment was designed in which students are randomly assigned to one of three groups based on how they study for a quiz. Group 1 simply reads the chapter, Group 2 reads and takes notes, Group 3 reads, takes notes, and uses a study guide. After each group studies, they take a quiz. Their quiz scores are listed below. Group 1 7 6 4 6 7...
- Fish Three different Classification schemes - Frog Scheme I Amphibia Mammalia Reptilia Aves Included groups...
 - Fish Three different Classification schemes - Frog Scheme I Amphibia Mammalia Reptilia Aves Included groups Frogs, Salamanders Mammals Lizards, crocodiles Birds Salassader Manuals Scheme II Ainphibia Mammalia Reptilia Ineladed groups Frogs, Salamanders Mammals Lizards, crocodiles, birds Lizard - Crocodile Scheme III Included groups Amphibia Frogs. Salamanders Homothenins* Mammals, birds Reptilia Lizards, crocodiles *Mammals & birds both maintain body temperature. Bird This phylogeny represents our current hypothesis for the relationship of some key groups of chordates. Use it and the...
A study was conducted to compare the effects of three different drugs on the alleviation of anxious depression in non-psychotic patients. Twelve non-psychotic patients, all suffering from moderate to...
A study was conducted to compare the effects of three different drugs on the alleviation of anxious depression in non-psychotic patients. Twelve non-psychotic patients, all suffering from moderate to severe depression and anxiety, were grouped according to initial level of severity. Patients in each severity level group were randomly assigned to the three treatments (drugs). At the end of the experimental period, a combined anxiety and depression score as determined by the MMPI and Taylor Manifest Anxiety Scale was recorded...
1:When performing a two-tailed test for the difference between means, with Ho:-=0, the hypothesized difference between...
1:When performing a two-tailed test for the difference between means, with Ho:-=0, the hypothesized difference between the two population means is zero. Select one: True False Question 2: If the null hypothesis is - 10 and the alternative hypothesis is - > 10, the appropriate test to use is a lower tail test. Select one: True False Question 3:Suppose it desired to compare two physical education training programs for preadolescent girls. A total of 82 girls are randomely selected, with...
 19) ANOVA F test was conducted to test whether the means of three groups are the same against at least one group mean is different. The total number of subjects in three samples were 30. The Fratio (test statistics) was 4.25 a) What is the p-value? b) What is your conclusion at 5% significance level? Are all group means the same?
 A university instructor uses different teaching methods on three separate computer science classes. The instructor wants to evaluate the effectiveness of the methods by comparing the grades between the classes. The grades have been transformed and are in the table below. What can the instructor conclude with a = 0.05? Method A Method B Method с 21 19 21 24 25 20 27 19 23 25 25 20 24 28 35 31 29 26 19 17 20 29 20 17...
 Application Exercise: A university instructor uses different teaching methods on three separate computer science classes. The instructor wants to evaluate the effectiveness of the methods by comparing the grades between the classes. The grades have been transformed and are in the table below. What can the instructor conclude with an a of 0.01? Method A Method B Method с 21 19 21 25 25 20 24 19 17 20 23 20 17 20 34 22 29 26 a) What is...
 In the United States, Scholastic Aptitude Test (SAT) scores are used by universities when selecting students for admission. Private companies and high schools offer SAT preparatory courses to help students improve their scores. This has led some people to ask, "Do SAT preparatory classes effectively increase SAT scores?" The following study, cited in a major newspaper, claims that they do (but not by a substantial amount): "A new study . . . shows that [SAT preparatory] classes are effective in...
 Question 21 You wish to co participants and administer a different test to each group. Which analysis should you use? mpare the results from three different personality tests. You get three groups of O two-way ANOVA 。x' goodness-of-fit t test one-way ANOVA Question 22 When we say that a result is statistically significant, we mean that we have rejected the alternative hypothesis a strong relationship was shown. O the results were too unlikely to have occurred by chance if the...
 - Fish Three different Classification schemes - Frog Scheme I Amphibia Mammalia Reptilia Aves Included groups Frogs, Salamanders Mammals Lizards, crocodiles Birds Salassader Manuals Scheme II Ainphibia Mammalia Reptilia Ineladed groups Frogs, Salamanders Mammals Lizards, crocodiles, birds Lizard - Crocodile Scheme III Included groups Amphibia Frogs. Salamanders Homothenins* Mammals, birds Reptilia Lizards, crocodiles *Mammals & birds both maintain body temperature. Bird This phylogeny represents our current hypothesis for the relationship of some key groups of chordates. Use it and the...
Most questions answered within 3 hours.
-
Where is the error in this code sequence?
String s1 = "Hello";
String s2 = "ello";...
asked 10 months ago -
Financial data for Joel de Paris, Inc., for last year
follow:
Joel de Paris, Inc.
Balance...
asked 10 months ago -
Consider this reaction:
Al2(SO4)3 (aq)+ BaCl3
(aq) Al2Cl6 (aq)- +
3BaSO4(s) . What is the...
asked 10 months ago -
Suppose that Savneet is considering increasing her
recent random sample from 20 car rentals to 40...
asked 10 months ago -
Trucks arrive at an unloading terminal at an average rate of 120
per hour.
Trucks arrive...
asked 10 months ago -
Why are methanol and ethanol completely soluble in water while
octanol is not very little soluble....
asked 10 months ago -
A facilities manager at a university reads in a research report
that the mean amount of...
asked 10 months ago -
When the CuSO4 is rehydrated by adding water to the anhydrous
compound, is this an endothermic...
asked 10 months ago -
A ray of sunlight is passing from diamond into crown glass; the
angle of incidence is...
asked 10 months ago -
A block of mass 0.249 kg is placed on top of a light, vertical
spring of...
asked 10 months ago -
how do the kidneys compensate in the presences of acidosis
a) trigger hyperventilate
b) reserve acid...
asked 10 months ago -
Question 501 pts
The rental rate of capital to the firm increases. Which of the
following...
asked 10 months ago