MATLAB
code starts here ---------
clear
T0=2;
w0=2*pi/T0;
f0=1/T0;
Tmax=4;
Nmax=15;
%---
i=1;
for t=-Tmax: .01:Tmax
T(i)=t;
if t>=(T0/2)
while (t>T0/2)
t=t-T0;
end
elseif t<=-(T0/2)
while (t<=-T0/2)
t=t+T0;
end
end
if abs(t)<=(T0/4)
y(i)=1;
else
y(i)=0;
end
i=i+1;
end
plot(T,y),grid, xlabel('Time (sec)'); title('y(t) square wave');
shg
disp('Hit return..');
pause
%---
a0=1/2;
F(1)=0; %dc freq
C(1)=a0;
for n=1:Nmax
a(n)=(2/(n*pi))*sin((n*pi)/2);
b(n)=0;
C(n+1)=sqrt(a(n)^2+b(n)^2);
F(n+1)=n*f0;
end
stem(F,abs,(C)), grid, title(['Line Spectrum: Harmonics = '
num2str(Nmax)]);
xlabel('Freq(Hz)'), ylabel('Cn'), shg
disp('Hit return...');
pause
%---
yest=a0*ones(1,length(T));
for n=1:Nmax
yest=yest+a(n)*cos(2*n*pi*T/T0)+b(n)*sin(2*n*pi*T/T0);
plot(T,y,T,yest),grid,
title(['Nmax = ' num2str(n)]), shg, pause(1)
end
code ends here ------

Homework Answers
MATLAB code is given in bold letters.
clc;
close all;
clear all;
T0=2;
w0=2*pi/T0;
f0=1/T0;
Tmax=4;
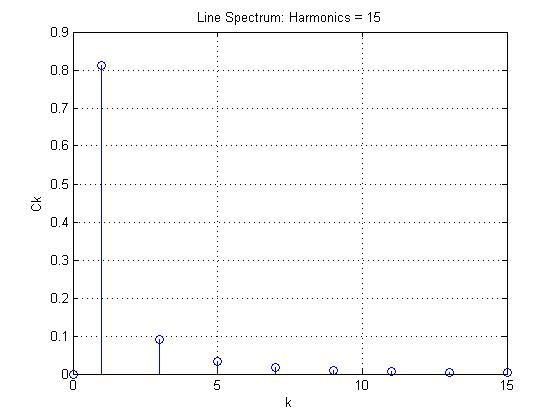
Nmax=15;
i=1;
a0=0;
F(1)=0;
A = 1; T0 =2;
n = 1:2:15;
a= 8*A./(n*pi).^2;
b=0;
C=sqrt(a.^2+b^2);
F(n+1)=n*f0;
stem([0 n],[a0 abs(C)]), grid, title(['Line Spectrum: Harmonics = '
num2str(Nmax)]);
xlabel('k'), ylabel('Ck')
disp('Hit return...');
pause
%---
t = -4:0.01:4;
for k=1:length(t)
x(k) = a0+sum(C.*cos(2*pi*n*t(k)/T0));
end
figure;plot(t,x);xlabel('time');
ylabel('Amplitude');title('x(t)');grid on;
title('Fourier series approximation with N = 15');
ylim([-1.5 1.5]);

Add Answer to:
MATLAB
code starts here ---------
clear
T0=2;
w0=2*pi/T0;
f0=1/T0;
Tmax=4;
Nmax=15;
%---
i=1;
for t=-Tmax: .01:Tmax...
R1=1e3; C=10e-6; % R=1K ohms, C=1 uF num = -1; den = [R1*C 1]; T=[0:.001:5]; W=...
R1=1e3; C=10e-6; % R=1K ohms, C=1 uF num = -1; den = [R1*C 1]; T=[0:.001:5]; W= logspace(1,3,20) for i= 1:length(W) w=W(i); u=cos(w*T); y=lsim(H1,u,T); gain(i)=max(y)/max(u); plot(T,u,T,y), grid, title(['x(t) & y(t): w = ' num2str(w)]) shg pause end semilogx(W,20*log10(gain)),grid, title('Frequency Response gain H1(w)'); xlabel(‘Freq (r/s)’) ylabel(‘db(H1)’) shg How can this code sweep a sine wave? And measure dB to get a frequency response
Execute the function, using 11 as Non, and 8 as Noff. function fourier_example(Non,Noff) %this function demonstrates...
Execute the function, using 11 as Non, and 8 as Noff. function fourier_example(Non,Noff) %this function demonstrates fourier analysis and synthesis for a simple %periodic rectangular wave of varying duty cycle. %Inputs: Non= integer number of seconds per period that the signal is on % Noff = integer number of seconds per period the signal is off t=-30:.001:30; %time scale Nharm = 20; %number of harmonics to calculate %construct a periodic square-wave with desired duty cycle x=zeros(size(t)); for k1=-Nharm:Nharm x =...
MATLAB %% T = 1; N = 11; np = 2; dt = 0.001; tmax =...
MATLAB %% T = 1; N = 11; np = 2; dt = 0.001; tmax = np*T; t = -tmax:dt:tmax; %% Function 1 %the following code was used to create the x(t) function xrange = floor((T/dt)/15); x1 = linspace(0,1,xrange); x2 = x1(end-1:-1:1); x3 = linspace(0,2,2*xrange); x4 = x3(end-1:-1:1); x5 = zeros(1,xrange); x6 = x1; x7 = 2*ones(1,xrange); x8 = 1+x2; x9 = -0.5*ones(1,xrange); x10 = x1/2-0.5; xtemp = [x1 x2 x3 x4 x5 x6 x7 x8 x9 x10]; ztemp =...
Need help converting the following code from Matlab into Python: N=2048; fs=4.9; t=0:1/fs:(N-1)/fs; fs1=200; t1=0:1/fs1:(N-1)/fs1; x2=0.5+0.6366.*cos(2.*pi.*t1)+0.1273.*cos(10.*pi.*t1)-0.0909.*cos(14.*pi.*t1);...
Need help converting the following code from Matlab into Python: N=2048; fs=4.9; t=0:1/fs:(N-1)/fs; fs1=200; t1=0:1/fs1:(N-1)/fs1; x2=0.5+0.6366.*cos(2.*pi.*t1)+0.1273.*cos(10.*pi.*t1)-0.0909.*cos(14.*pi.*t1); x=0.5+0.6366.*cos(2.*pi.*t)+0.1273.*cos(10.*pi.*t)-0.0909.*cos(14.*pi.*t); X=fftshift(fft(x)); f=linspace(-fs/2,fs/2,N); plot(f,abs(X)./N); xlabel('f'); ylabel('|F(f)|'); title('magnitude spectrum of sampled signal'); x1=ifft(fftshift(X)); figure plot(t(1:100),x1(1:100)); xlabel('t'); ylabel('f(t)'); title('f(t) obtained by inverse transform'); figure plot(t1(1:1000),x2(1:1000)); xlabel('t'); ylabel('f(t)'); title('original f(t)');
Hello, i have this matlab code where i have to track a red ball from and...
Hello, i have this matlab code where i have to track a red ball from and uploaded video, and plot its direction in x-y direction My Question is how can i add x vs time plot and y vs time plot in this code. Thank you if exist('V','var') delete(V); end clear;clc; V=VideoReader('video.mp4'); figure(1); x=[];y=[]; i=1; while hasFrame(V) J=readFrame(V); figure(1);imshow(J);title(['Frame No. ',num2str(i)]); if (i>=28 && i<=132) bw=J(:,:,1)>200 & J(:,:,2)<80 & J(:,:,3)<80; bw=imfill(bw,'holes'); A=regionprops(bw,'Centroid'); x(end+1)=A.Centroid(1); y(end+1)=A.Centroid(2); hold on; plot(x,y,'*k');hold off; end i=i+1;...
You are given a finite step function xt=-1 0<t<4 1 4<t<8. Hand calculate the FS coefficients of...
You are given a finite step function xt=-1 0<t<4 1 4<t<8. Hand calculate the FS coefficients of x(t) by assuming half- range expansion, for each case below. Modify the code below to approximate x(t) by cosine series only (This is even-half range expansion). Modify the below code and plot the approximation showing its steps changing by included number of FS terms in the approximation. Modify the code below to approximate x(t) by sine series only (This is odd-half range expansion).. Modify...
I need this program in MATLAB with different or another code. INPUT: x = [0 1...
I need this program in MATLAB with different or another code. INPUT: x = [0 1 8 12 27]; y = [1 2 3 4 5]; nx = length(x); ny = length(y); n = length(x); if nx ~= ny display('Error. La cantidad de datos en x no es igual que los datos en y') end Sx = sum(x); Sxx = sum(x.^2); Sy = sum(y); Sxy = sum(x.*y); a1 = (n*Sxy - Sx*Sy)/(n*Sxx-(Sx)^2); a0 = (Sxx*Sy - Sxy*Sx)/(n*Sxx - (Sx)^2); m...
Amplitude=3; fs=8000; n=0:399; t=0:1/fs: n*1/fs-1/fs; signal=3+3*cos(2*pi*1100*t)+3*cos(2*pi*2200*t)+3*cos(2*pi*3300*t); fftSignal= fft(signal); fftSignal=f ftshift (fftSignal); f=fs/2*linspace(-1,1,fs); plot(f,abs(fftsignal); xlabel('Frequency(Hz)’) yla
Amplitude=3; fs=8000; n=0:399; t=0:1/fs: n*1/fs-1/fs; signal=3+3*cos(2*pi*1100*t)+3*cos(2*pi*2200*t)+3*cos(2*pi*3300*t); fftSignal= fft(signal); fftSignal=f ftshift (fftSignal); f=fs/2*linspace(-1,1,fs); plot(f,abs(fftsignal); xlabel('Frequency(Hz)’) ylabel('amplitude(v)') title('Spectral domain') plz code above using For ..End loop to archive the same results.
please help me with this MATLAB CODE and explain to me what each line does and...
 please help me with this MATLAB CODE and
explain to me what each line does and what is used for?
leave your comments as words, not as pictures.
.....................................................................................................................................................................
clear all; close all; % For a script file, you better start with
clear all and close all
% However, for a fucntion, you better NOT to start
% with them
%% End of cell mode example
%% Plot function
t = 0:0.1:5;
x1 = sin(2*5*t); x2 = cos(3*7*t);...
please help me with this MATLAB CODE and
explain to me what each line does and what is used for?
leave your comments as words, not as pictures.
.....................................................................................................................................................................
clear all; close all; % For a script file, you better start with
clear all and close all
% However, for a fucntion, you better NOT to start
% with them
%% End of cell mode example
%% Plot function
t = 0:0.1:5;
x1 = sin(2*5*t); x2 = cos(3*7*t);...
CAN YOU PLEASE CHECK WHATS WRONG? function[F]=func(t,h) global Atank Ahole kOne kTwo g rho %F=zeros(2,1) %NL=y(1)...
CAN YOU PLEASE CHECK WHATS WRONG? function[F]=func(t,h) global Atank Ahole kOne kTwo g rho %F=zeros(2,1) %NL=y(1) %NG=y(2) F=(kOne+kTwo*cos(2*pi*t/24)-rho*Ahole*sqrt(2*g*h))/(rho*Atank); close all clear all %clear all %close all global Atank Ahole kOne kTwo g rho Atank = 3.13;% Atank value Ahole =0.06; %Ahole value kOne = 300; % K1 value kTwo = 200; % K2 value g = 9.81; % Gravity rho = 1000; % rho value t0=0; tf=150; %range of time %Initial value h0_2=h(1); h0_1=h(2); h0_0=h(3); n=input('Enter the number of steps:');...
 please help me with this MATLAB CODE and
explain to me what each line does and what is used for?
leave your comments as words, not as pictures.
.....................................................................................................................................................................
clear all; close all; % For a script file, you better start with
clear all and close all
% However, for a fucntion, you better NOT to start
% with them
%% End of cell mode example
%% Plot function
t = 0:0.1:5;
x1 = sin(2*5*t); x2 = cos(3*7*t);...
please help me with this MATLAB CODE and
explain to me what each line does and what is used for?
leave your comments as words, not as pictures.
.....................................................................................................................................................................
clear all; close all; % For a script file, you better start with
clear all and close all
% However, for a fucntion, you better NOT to start
% with them
%% End of cell mode example
%% Plot function
t = 0:0.1:5;
x1 = sin(2*5*t); x2 = cos(3*7*t);...
Most questions answered within 3 hours.
-
Where is the error in this code sequence?
String s1 = "Hello";
String s2 = "ello";...
asked 10 months ago -
Financial data for Joel de Paris, Inc., for last year
follow:
Joel de Paris, Inc.
Balance...
asked 10 months ago -
Consider this reaction:
Al2(SO4)3 (aq)+ BaCl3
(aq) Al2Cl6 (aq)- +
3BaSO4(s) . What is the...
asked 10 months ago -
Suppose that Savneet is considering increasing her
recent random sample from 20 car rentals to 40...
asked 10 months ago -
Trucks arrive at an unloading terminal at an average rate of 120
per hour.
Trucks arrive...
asked 10 months ago -
Why are methanol and ethanol completely soluble in water while
octanol is not very little soluble....
asked 10 months ago -
A facilities manager at a university reads in a research report
that the mean amount of...
asked 10 months ago -
When the CuSO4 is rehydrated by adding water to the anhydrous
compound, is this an endothermic...
asked 10 months ago -
A ray of sunlight is passing from diamond into crown glass; the
angle of incidence is...
asked 10 months ago -
A block of mass 0.249 kg is placed on top of a light, vertical
spring of...
asked 10 months ago -
how do the kidneys compensate in the presences of acidosis
a) trigger hyperventilate
b) reserve acid...
asked 10 months ago -
Question 501 pts
The rental rate of capital to the firm increases. Which of the
following...
asked 10 months ago